Shoplifting: Anti-theft technologies are becoming increasingly popular
By Pierre-Nicolas Schwab •
Shoplifting has become a major problem for retailers. Increasingly sophisticated technological solutions are available on the market. Here's an overview.

Free Generative AI Detectors: Which Ones to Choose? [Complete Test 2025]
In this article, I share the results of a test I conducted on 11 generative AI detectors. A clear winner emerges among the free tools. The results are mixed, or even frankly poor, for half of the AI detectors tested.
Where to find traffic data for your market research?
What is the purpose of traffic data in market research? Where to find this data for free? I explain everything in this article.
Territorial marketing: better results thanks to flow data
In this article, I explain how to use flow data (cars and pedestrians) as a factual basis for a territorial marketing project.
Copytrack: revelations about a copyright troll on the edge of legality
In this article, I explain how to defend yourself against Copytrack. I tested their system, discovered its flaws, and share all my advice here. To stop their practices, file a complaint!
PicRights + AFP: a well-established copyright trolling operation
By Pierre-Nicolas Schwab •
PicRights is a company that is making a name for itself on the Internet as a copyright troll acting on behalf of AFP (Agence France Presse). The practice of copyright trolling has been deemed an abuse of rights by the…
Deadbots: chatbots that are not without risk
Deadbots are a category of chatbots that offer the possibility of talking to dead people. The first of these were developed before the advent of ChatGPT, and in hindsight, they are not without their risks. I analyze them in this article and examine the question of criminal liability with them.
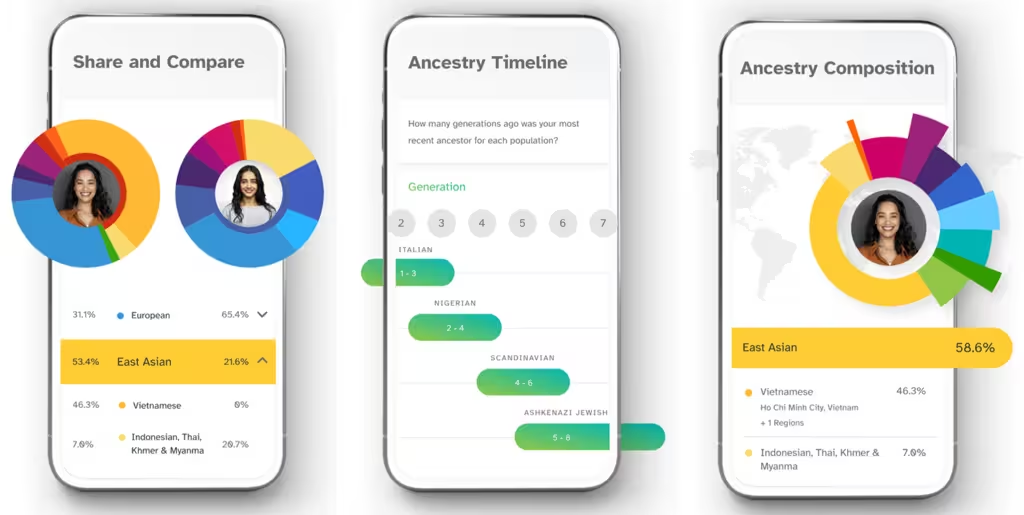
23andMe: a case study in the sensitivity of health data
The 23andMe company offered DNA tests for recreational purposes. It's in a particularly delicate situation, and its data is in danger of being sold to the highest bidder. In this article, I explain the risks involved and the likely scenarios.
Backlink scam: DMCA Copyright Infringement Notice
ctrl+cIn this article, I show you that the requests entitled "DMCA Copyright Infringement Notice" received by email are scams. I will explain what motivates scammers to prepare such an elaborate scam.
SEO is dead, and Google killed it
In this article, I explain why I think SEO is dead. Google's algorithm updates in September 2023 and March 2024 were masking a complete shift in strategy from quality results to commercial alliances. I'll illustrate my point with several real-life examples.
How to apply the 8 laws of Gestalt to data visualization
In this article, I explain how to use the Gestalt laws to create better data visualization. Each law is illustrated with an example, and I've also listed the best practices and mistakes to avoid for each one.
LinkedIn remains under-used by marketing managers [Research]
In this research, I examined the LinkedIn activity of 520 marketing managers. These professionals need to make more use of this social network. I've included all the statistics in this research.
Energy-efficient software: a source of competitiveness
Energy efficiency is a concept that also applies to IT. In this article, I develop the idea that choosing a software solution based on its programming language can bring productivity and financial gains.
Data visualization: 6 bad examples analyzed
In this article, I dissect 6 examples of data visualizations (DataViz) that have more or less serious errors.
What if Bard (Google) was trained on data from Gmail?
The scandal is potentially huge. Kate Crawford posted on Twitter (see screenshot below) a response by Bard, Google's conversational agent using generative AI, to a seemingly innocuous question, "Where does Bard's data come from?" Although Bard's answer may be a hallucination, it…
chatGPT plugins: disruptive to the future of tech
Expedia just announced on Twitter the launch of a plugin powered by chatGPT's generative AI. At the same time, a "hacker" revealed the "secret" list of plugins available on chatGPT. Contrary to popular opinion, this will not challenge Google search as we know…
ChatGPT: 4 sources of risk for inbound marketing
Companies that rely on SEO to find customers may need help with llead generation. After a few weeks of using ChatGPT and the new Bing, I look at the dangers of these conversational agents for companies using inbound marketing. Based on the search context, I…
ChatGPT and Bing won’t replace Google. Here’s why.
According to Microsoft, 50% of online searches could be carried out via a conversational agent (Chat BOT) based on generative AI. But what if Internet users are not interested in this value proposition? Everything depends on Internet users' willingness to change how…
ChatGPT: 1000 texts analyzed and up to 75,3% similarity
Is every answer generated by ChatGPT unique? Or are we overestimating its ability to produce different texts? This is the question I asked myself after analyzing 1000 texts produced by ChatGPT. I compared the similarity between 1,000,000 pairs of texts…
6 algorithms that have triggered disaster
Algorithms are increasingly used to help humans in their decisions. A poorly programmed algorithm, or humans lacking critical thinking skills, are recurrent causes of algorithmic errors. These errors sometimes trigger users' anger or incite them to hack them. This article analyzes 6 algorithmic errors that…
ETL: Anatella in web version with high performance
If you are interested in data science, you know that data preparation is a very time-consuming step. That's why choosing the right ETL software is so important. My favorite solution is called Anatella. I appreciate its qualities in terms of speed and the richness of the…
Patek Philippe Nautilus: how have prices changed in 4 years?
How much does a Patek Philippe Nautilus cost? How will Nautilus prices evolve? Answering these questions, as relevant as they are, has become extremely difficult following the bubble formed in the luxury men's watch market. Some models have seen their prices explode.…
LinkedIn’s algorithm changed again in 2022: what impact?
LinkedIn's algorithm underwent some pretty significant changes in May 2022. LinkedIn introduces constraints in its algorithm and takes into account more explicit variables. This has had a substantial impact on the visibility of posts. Although the basic functioning of the LinkedIn algorithm is not changed, we…
57 unpublished Linkedin statistics
The LinkedIn statistics you find on the internet are often the same: the number of users, geographical distribution, and age ... In this article, we offer you 57 new LinkedIn statistics. They are unpublished simply because they are calculated from a dataset that…
Men – Women: the battle for influence is unequal on LinkedIn
In a first analysis, I showed that most female influencers on LinkedIn were young (18-30). Could age be a factor in the virality of LinkedIn posts? To be sure, I had to check if my first conclusions applied to men too. If you…
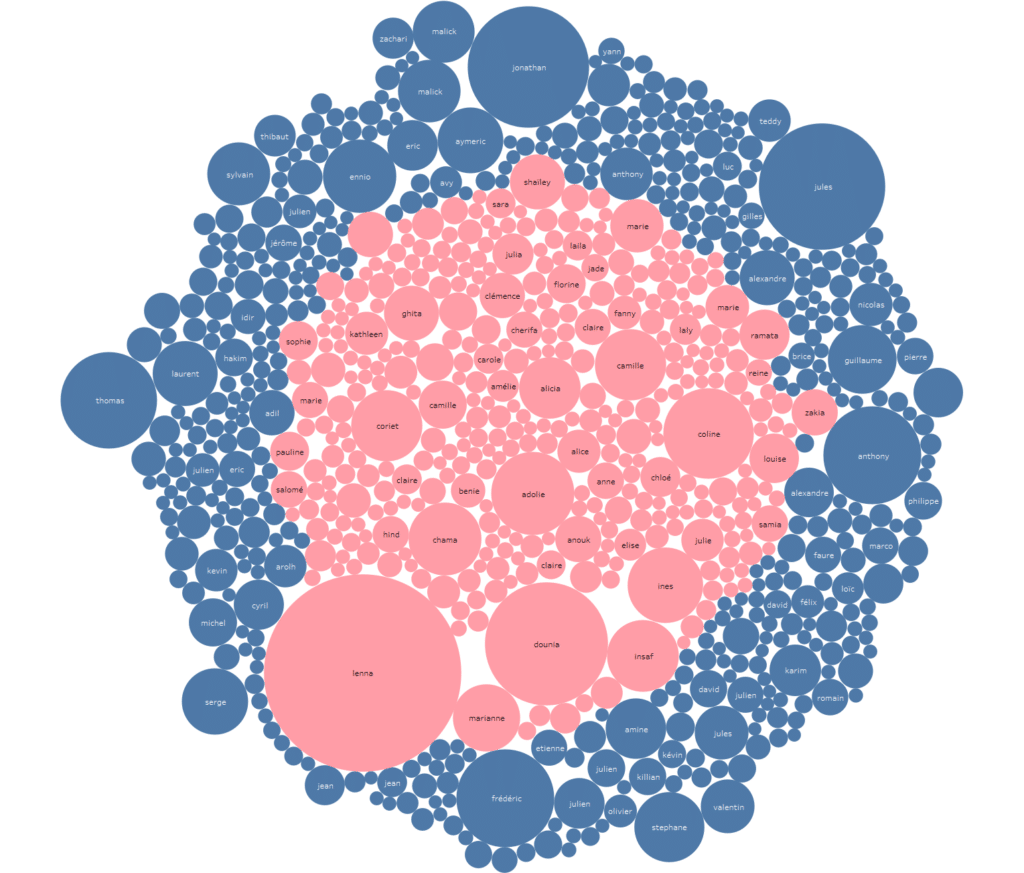
On LinkedIn, women are 17.3% more viral than men
Is it better to be a woman to be a LinkedIn influencer? At least, that's what a preliminary study we conducted suggested. Today we extend this study to nearly 5 million LinkedIn posts. The results show that beyond 500 reactions, women's posts get 17.3%…
On LinkedIn, to create a Buzz, it is better to be a young woman…
Analysis of 1118 viral LinkedIn posts shows the domination of women in terms of reactions (likes and comments). Among these influencers, there is also apparent domination (nearly 50%) of women aged 18 to 30. This domination is exercised in terms of the…
CBD online: French and English, all addicted! [SEO Research]
SEO research on online searches related to CBD shows that 2 countries share the first place. France and the UK have the highest number of searches per capita. The SEO research we realized in 31 countries also shows significant differences…
ETL: comparison, selection criteria, advice [guide 2022]
ETL: Extract - Transform - Load. These 3 words alone summarize the functionalities that software solutions belonging to this family must fulfil. THEREFORE, an ETL tool is a software that simplifies data preparation, local or on the cloud. The latter focuses…
Netflix ratings: tough competition for the most popular movies and series
Netflix now publishes its weekly ratings in the form of a TOP 10 of the number of hours watched worldwide. Although Netflix only publishes the total number of hours watched, this data is still rich in information for those who want…
We forgive mistakes made by algorithms more easily than by humans
Algorithms have taken over. They are in charge of making more and more decisions. More and more complex decisions affect all aspects of our lives. But algorithms are not perfect. They also make mistakes. So, a question arises: do we forgive algorithms more…
Cloud Act and GDPR: can we host our data in the Cloud?
Does your use of cloud services lead you to violate the GDPR? Can you store your data on AWS, Azure, ... and still comply with the GDPR? The American Cloud Act sows doubt and creates a legal uncertainty which we discussed with…
The panda is the most rewarding emoji on LinkedIn
An analysis of 2.9 million emojis on LinkedIn delivers a surprising piece of information: the ? emoji elicits the most reactions. This research offers us an opportunity to critically look at the data and understand the origin of a polluting LinkedIn phenomenon.…
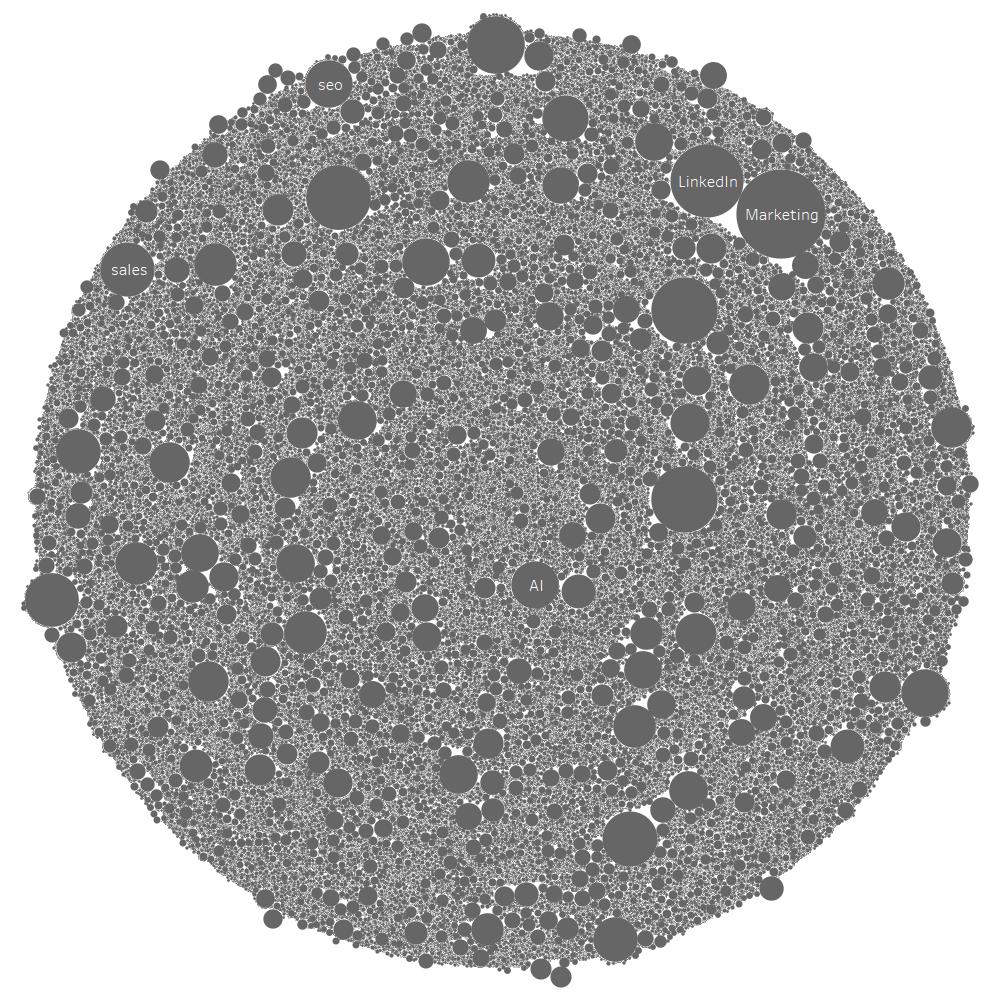
The most used emojis on LinkedIn [analysis and statistics]
What are the most used emojis on LinkedIn? Do the most used emojis on LinkedIn vary by language and country? In this analysis, discover exclusive statistics on the use of emojis on LinkedIn. If you're passionate about LinkedIn statistics, don't…
Which are the most popular hashtags on LinkedIn?
Hashtags on LinkedIn are probably one of the most popular topics about this social network. So naturally, there are assumptions about how LinkedIn's algorithm uses hashtags. However, I have shown statistically here that hashtags do not significantly impact the virality of posts. Anyway, the…
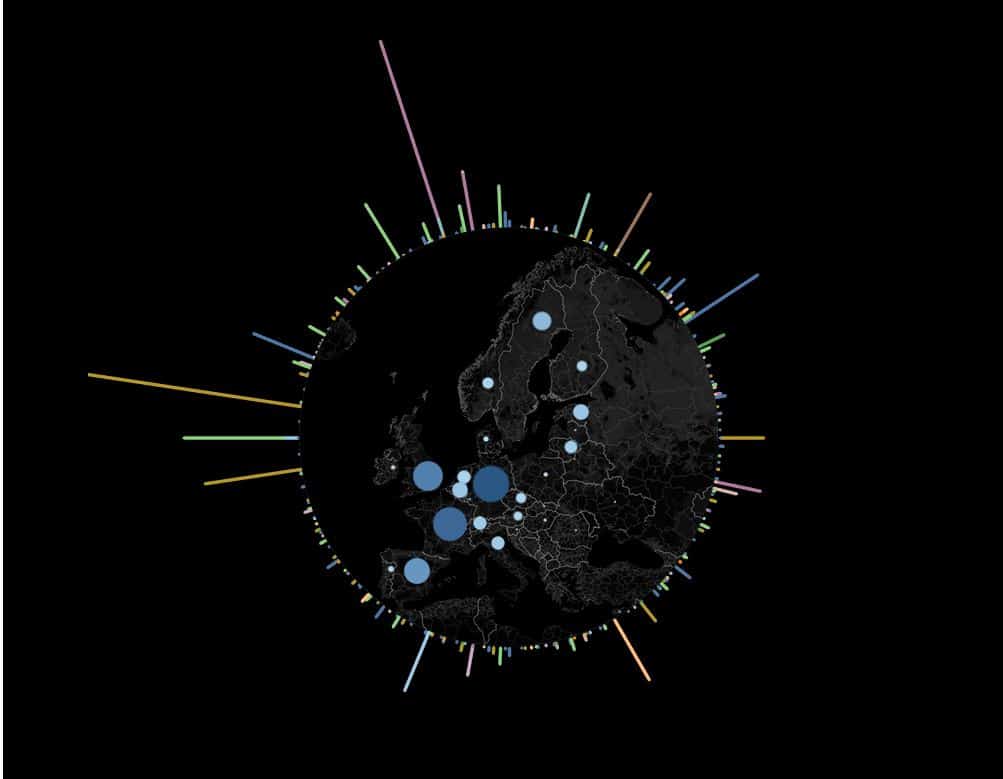
Tableau tutorial: a radial diagram and a pie chart
How to make a radial diagram using Tableau? How to integrate a pie chart? In this article, I guide you step by step in the realization of this data visualization. Introduction For my subsequent research on fundraising in Europe, I wanted…

![Illustration of our post "Free Generative AI Detectors: Which Ones to Choose? [Complete Test 2025]"](/blog/app/uploads/sherlock-holmes-jpg.webp)


![Illustration of our post "CBD online: French and English, all addicted! [SEO Research]"](/blog/app/uploads/cbd-1024x683.jpg)
![Illustration of our post "ETL: comparison, selection criteria, advice [guide 2022]"](/blog/app/uploads/ETL-extract-transform-load.jpg)


![Illustration of our post "The most used emojis on LinkedIn [analysis and statistics]"](/blog/app/uploads/most-used-emojis-linkedin-country-1024x931.jpg)