
In their attempt to understand how the LinkedIn algorithm works, users of this social network often debate the ideal time to put their content online. I decided to do some analysis to get to the bottom of the truth and myths in this story.
If you are interested in this kind of analysis and want to do the same with your data, subscribe to our newsletter (below). When the procedure and tools are ready to be released to carry out these analyses, you will be the first to be informed.

Introduction
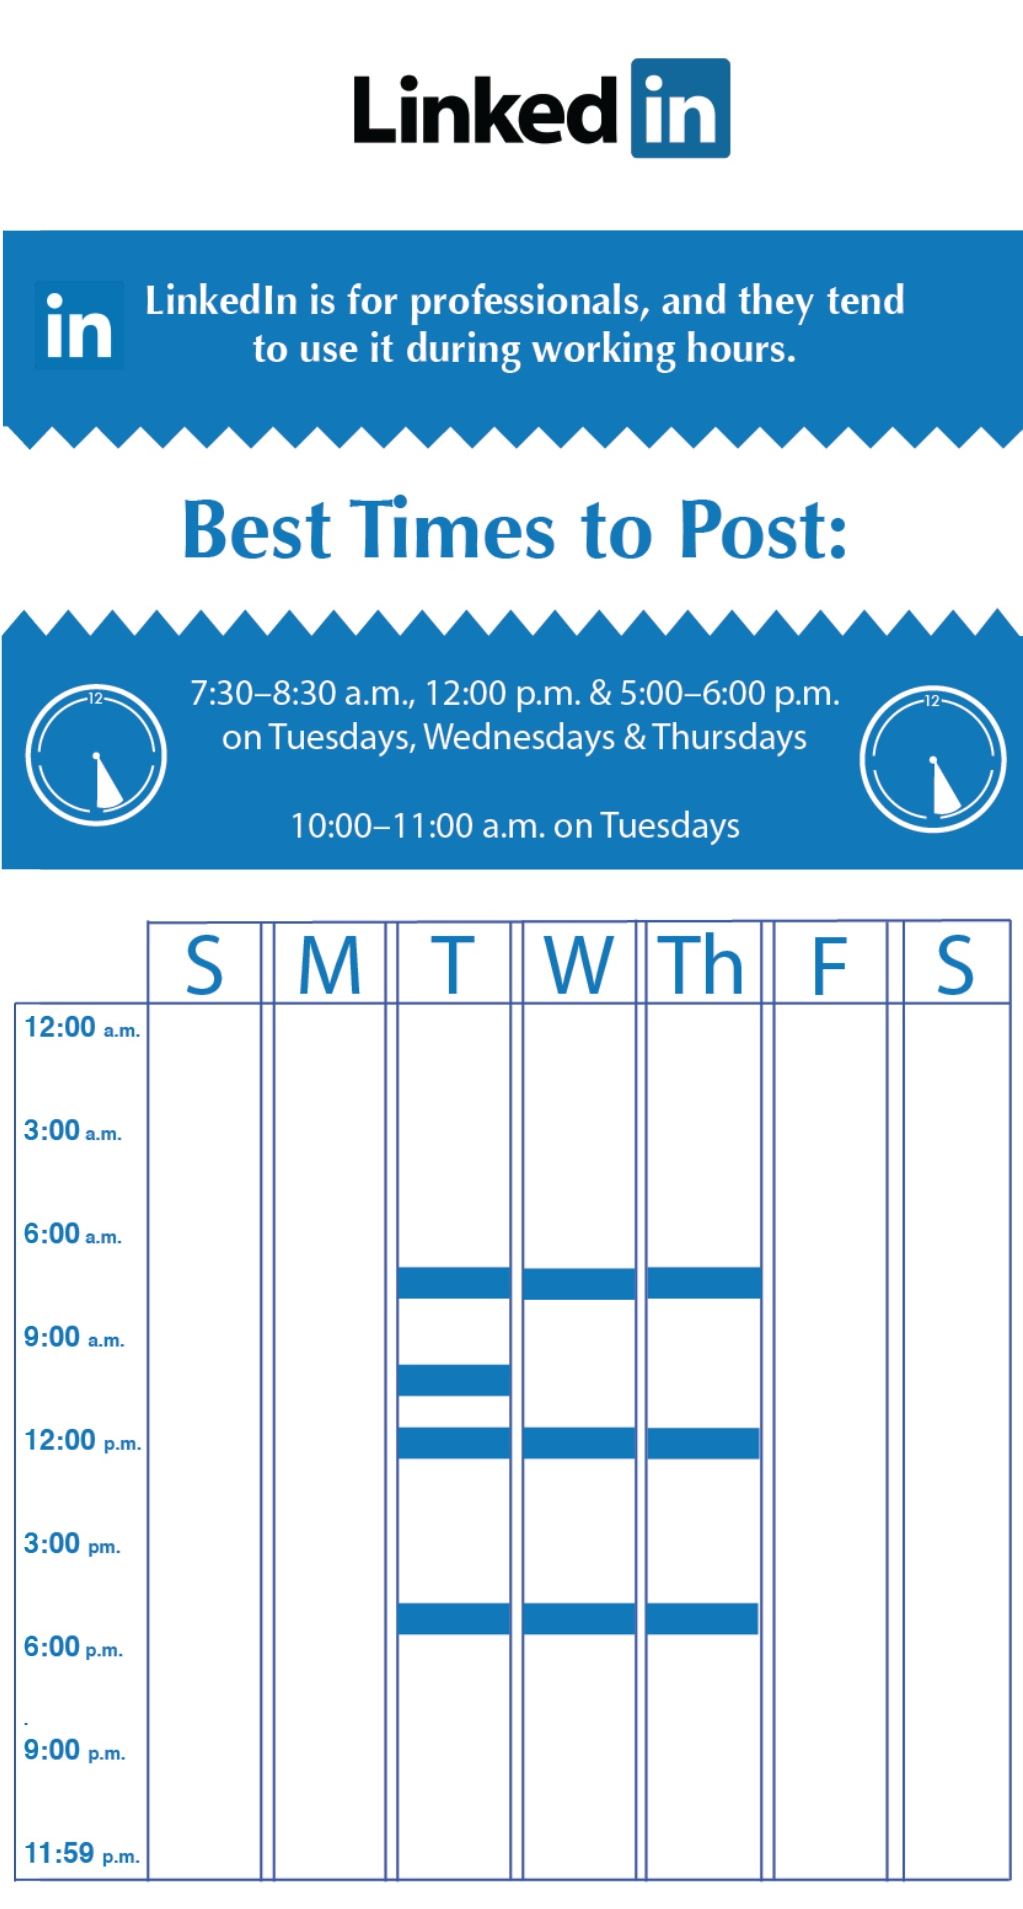
As early as 2016, LinkedIn itself published a blog post that gave indications on the best time to publish your content. It echoed a graphic design published by HubSpot (see opposite) which stated that LinkedIn’s material should be released on Tuesday, Wednesday and Thursday:
- in the morning between 7:30 and 8:30 am.
- at noon
- in the afternoon between 5:00 and 6:00 pm.
In the luxury of detail, we even learned that on Tuesdays, it was better to publish between 10 and 11 am.
These assertions were repeated over and over again, and each “influencer” went there with his analysis.
Since then, we have seen a flowering of predictions every year, as the algorithm changed. Now some even make predictions by sector of activity.
Even if the numbers are there, I don’t think there is a universal truth. So, I decided to get down to business and take a detailed look at how my LinkedIn posts were performing.
This is the story I’m going to tell you through graphs and visualisation using Tableau. Let me make it clear from the start that these analyses have no commercial aim and that they are part of the research programme that I am conducting with my colleague Laurence Rosier at the LaDisco laboratory of the Université Libre de Bruxelles.
Methodology
Accessing LinkedIn data was a real methodological challenge. LinkedIn has an annoying tendency of preventing you from accessing your own data. So, it took a lot of patience to reconcile disparate datasets. This was only possible thanks to Anatella, an ETL (Extract-Transform-Load) solution that I have already mentioned.
Thanks to Anatella, I was able to reconstruct a complete dataset of 675 posts. The reconciliation process is visible below (click on the image to enlarge it) and is based on 3 datasets:
- an archive file of my posts of the last 10 years (this file contains the precise moment of publication, which is called the “timestamp”)
- a JSON file that allows matching post IDs (URN and Share URN)
- an XML file that helps to retrieve likes, comments and number of views.
I want to thank Anatella’s creator, Frank Vanden Berghen, for his precious help in extracting the XML file as well as my friend Michael for his support in writing the code to extract the JSON file.

Results
Here’s the part you’ve all been waiting for. So, stop bullshitting and start analysing objective data instead.
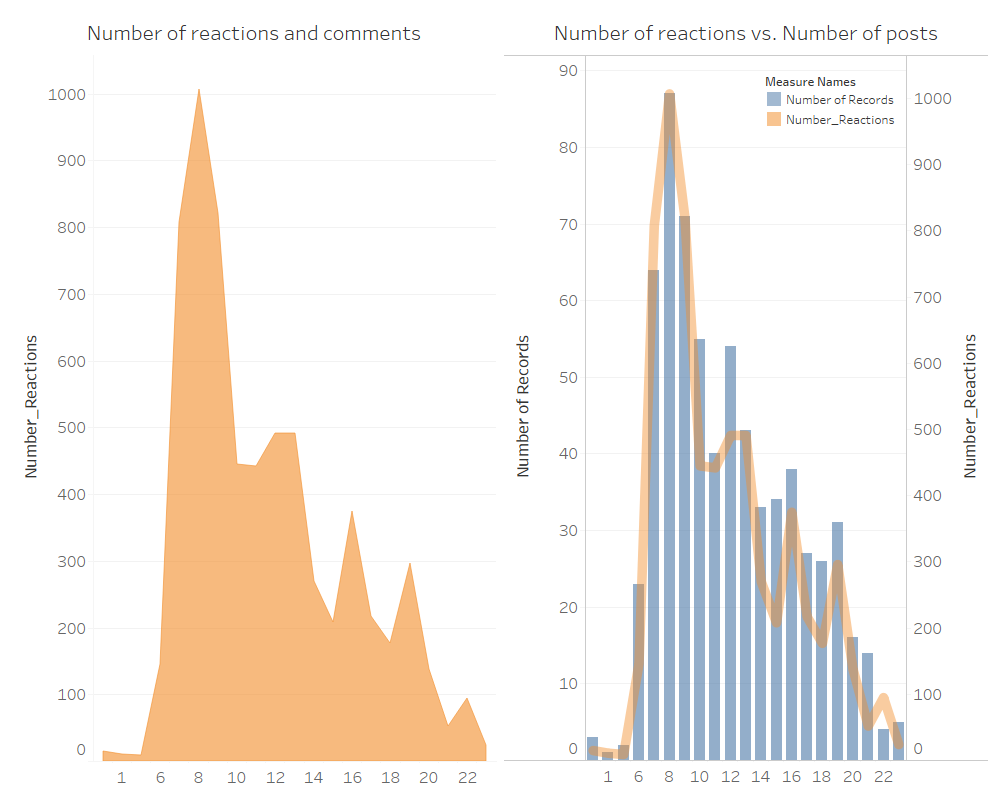
 The analysis of the number of reactions obtained according to the time of publication shows that the 8h-9h slot is the one during which I got the most responses (likes + comments). As shown in the graph on the right, more than 1000 reactions have been collected in this way.
However, care must be taken not to jump to conclusions. Indeed, if you compare the graph of the number of reactions obtained (in orange) with the number of posts published (in blue), you will realise that they overlap rather well.
 In other words, the number of reactions follows your publishing habits. To determine the most suitable publication slots, you need to look at the number of responses per publication. However, this measurement is imperfect because your messages vary. It is, therefore, a slightly more accurate indicator, but it is far from giving a perfect picture. This methodological precaution being taken, here is what it provides.
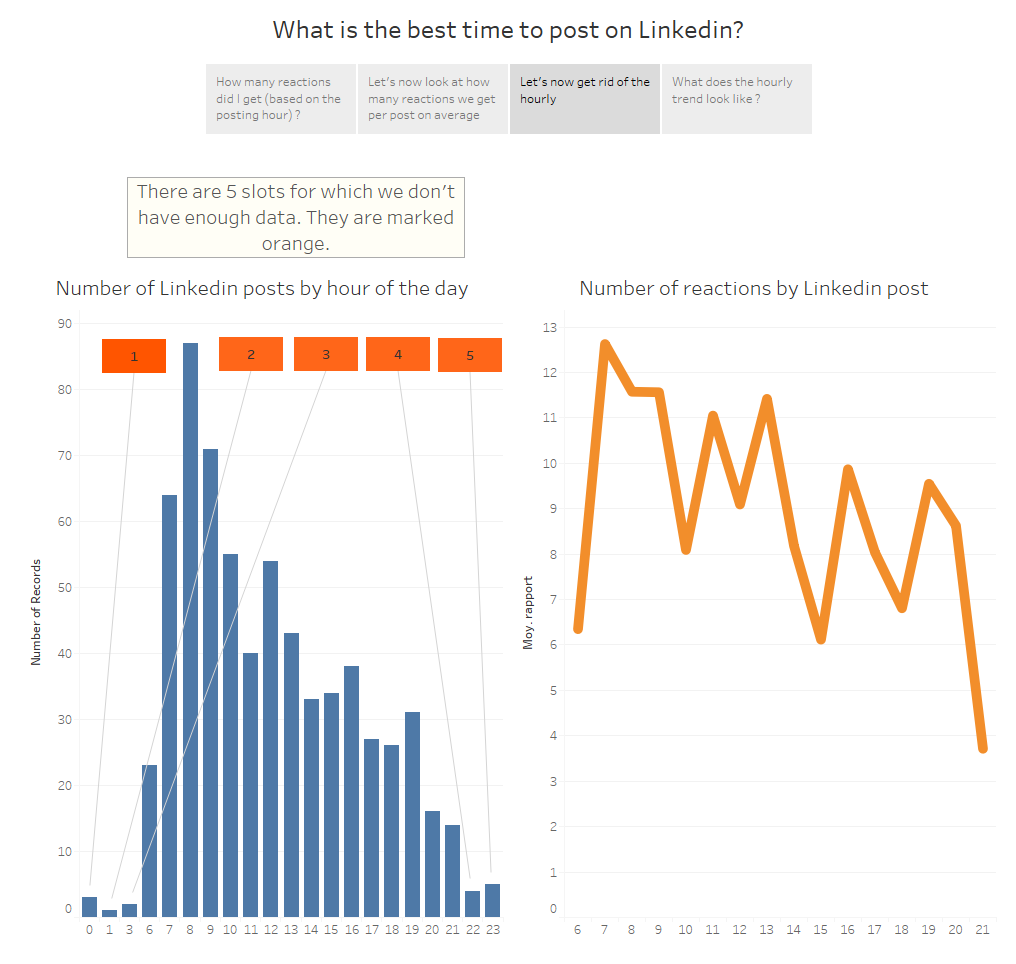 After eliminating the values for which there is not enough data (left, above), we get a graph (right, above) that represents the number of reactions per LinkedIn publication. We can see that a “downward” trend seems to apply from 7:00 am to 9:00 pm.
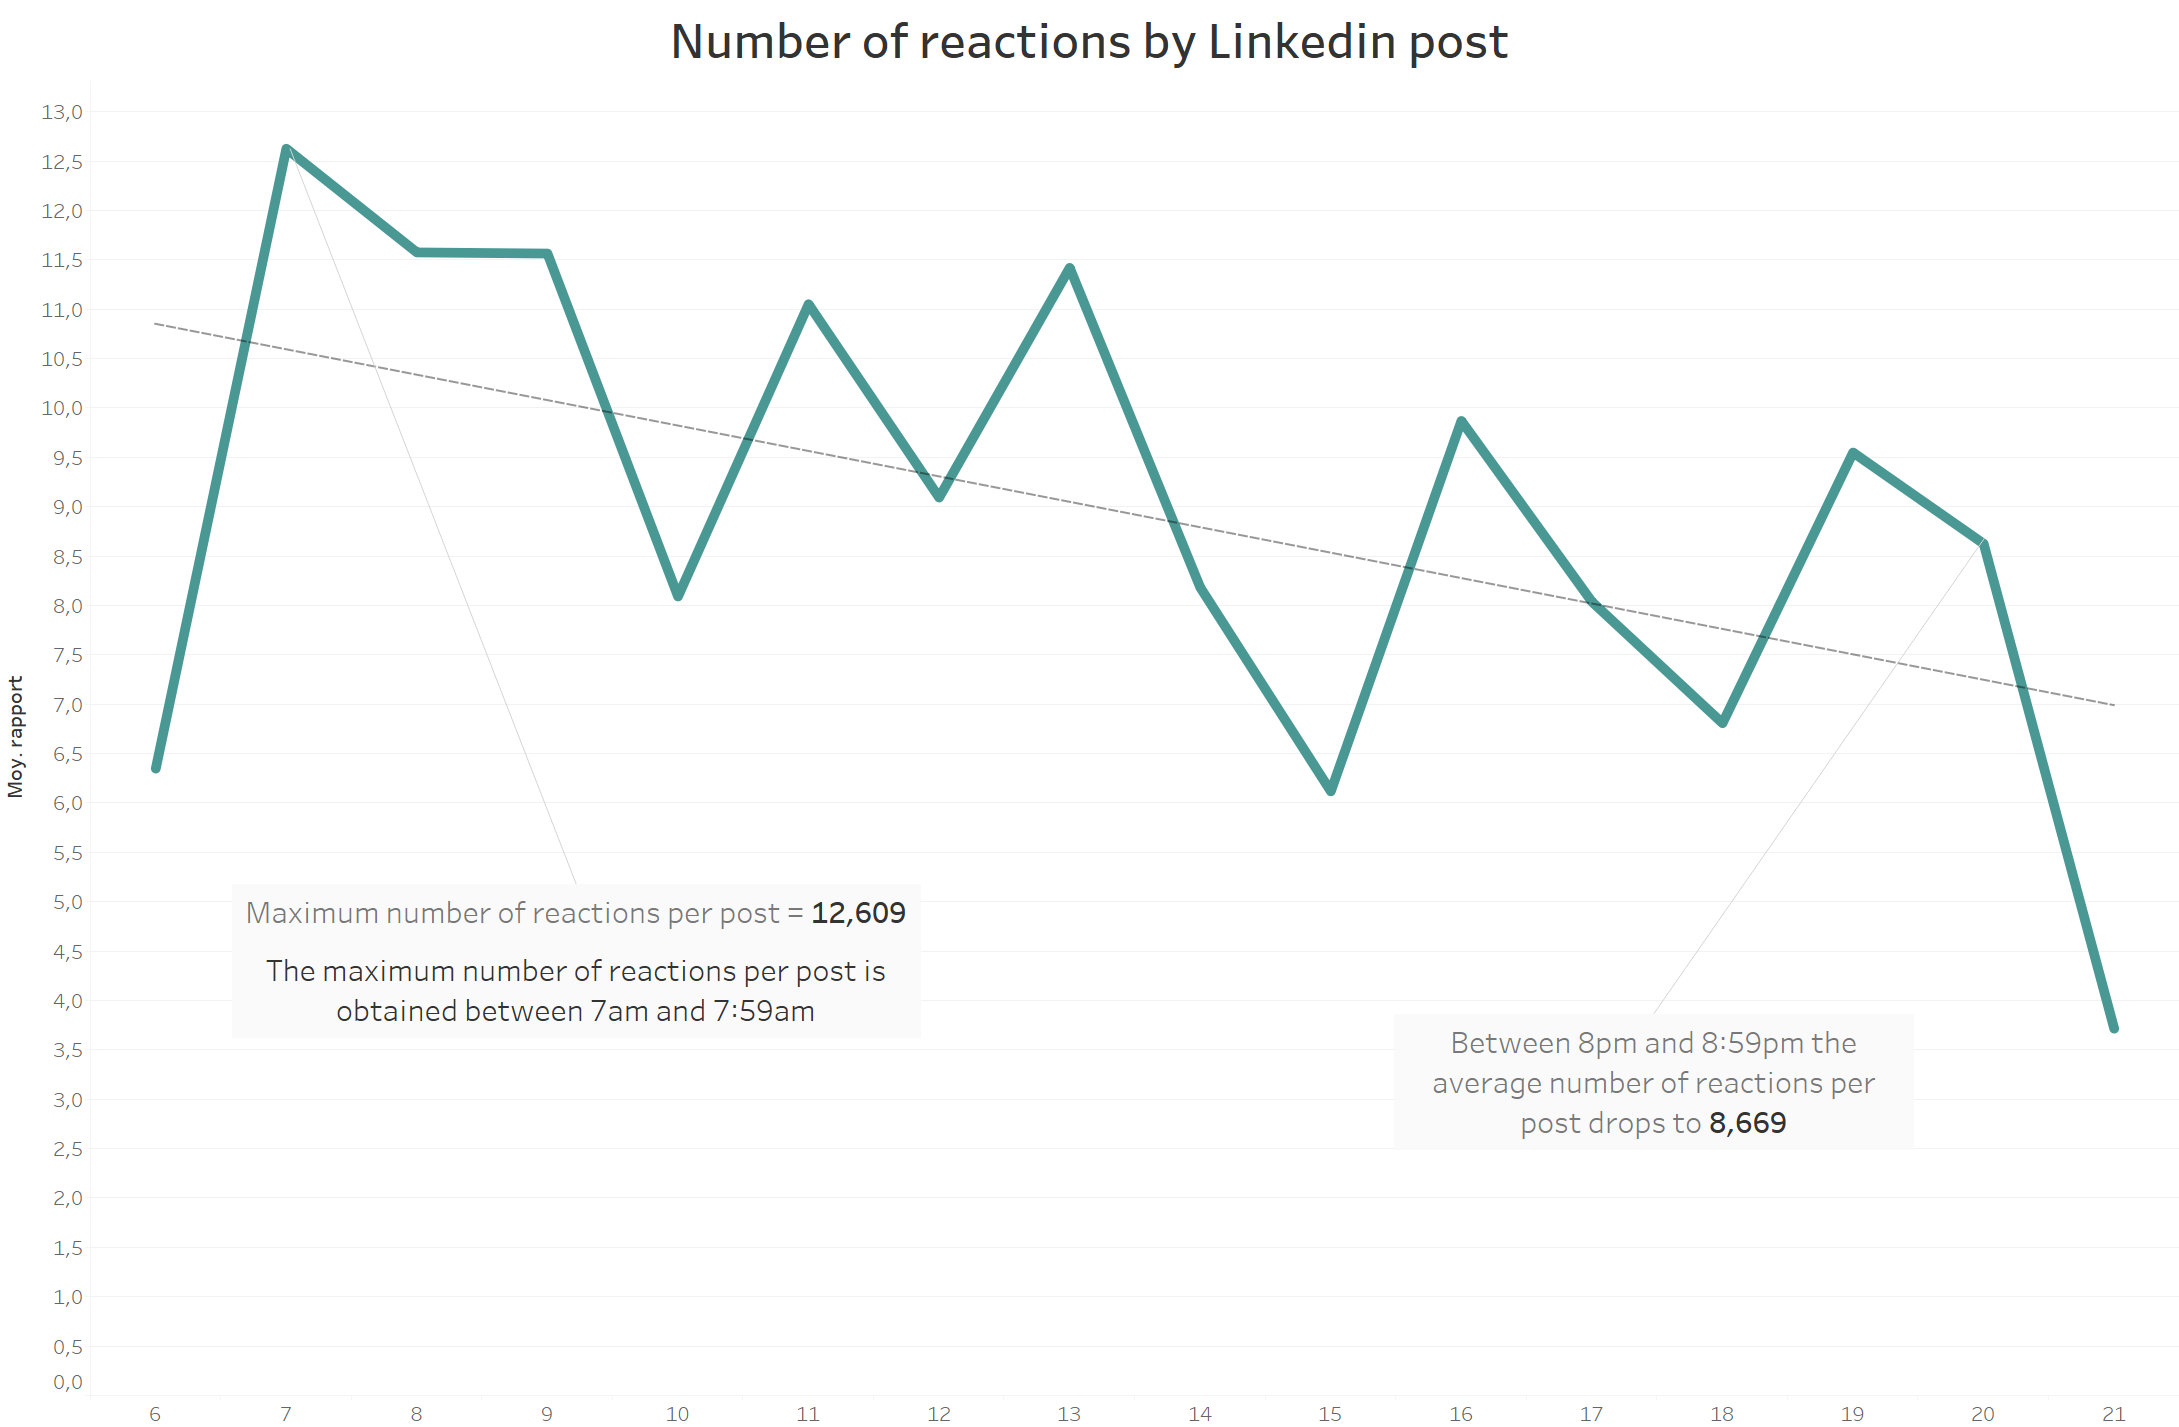
A linear regression (far from perfect) allows us to objectify this trend. We can see that the average number of reactions per post seems to decrease slightly from hour to hour.

Conclusion
The analysis of a dataset composed of 675 messages posted on LinkedIn makes it possible to objectify the hypotheses concerning the best time of publication on LinkedIn. In my case, the average number of reactions seems to decrease slightly during the day. However, this decrease remains very relative, and it is therefore difficult to conclude that one publication time slot is more important than another.