In the world of data, data wrangling is a bit of a buzzword these days. We have already proposed a general overview here. In today’s article, we explain it in more detail and position data wrangling within the data value cycle.
Summary
What is Data Wrangling?
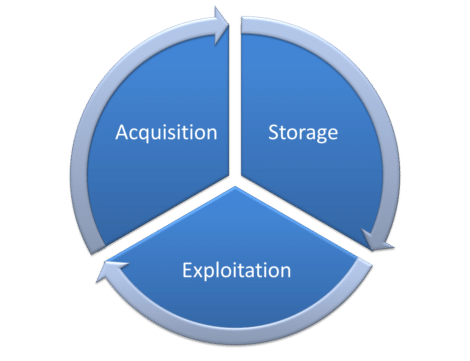
Data wrangling is a term that refers to a series of activities required to extract value from data. These activities are primarily located at level 1 (acquisition) of the data wrangling cycle (diagram below). They are also, for a small part, part 3 (exploitation).
The difference between data wrangling on the one hand and data preparation / data exploration, on the other hand, is tenuous. The term is mainly used in a context where data is “messy” and volumes are high.
The commercial use of the term “data wrangling” is due to Trifacta. To mark the difference with data preparation/data exploration, Trifacta sprinkles data wrangling with artificial intelligence. But let’s not be fooled. This is a commercial gimmick.
crédits : Shutterstock
STEP 1: Data acquisition
Data acquisition is the heart of the data wrangling activity. It is at this level that activities related to data preparation and data exploration take place.
Collecting data from various sources
One of the first challenges is collecting the information that is “split” into a multitude of files today. The expansion of data is such that recent research estimates that the business does not list 52% of the “dark data.” Files can be structured (Excel, CSV, relational table files) or unstructured (XML, JSON, PDF). They can come from within the business or from outside.
Data discovery and understanding phase
During this stage, we try to answer the question: “What does each data source contain? “. To do this, it is helpful to have:
- a tool that allows you to quickly make a few graphs to visually orient yourself in the data (see my classification of the essential ETL functionalities for this purpose)
- a metadata dictionary.
Data cleansing
It is illusory to think that your data will be directly “ready to use.” You will first have to clean them up, making sure, for example, that the “gender” column only contains 3 different values (male, female, unknown) and not one more.
Data enrichment
In the age of GDPR and the end of third-party cookies, data enrichment is mainly done by crossing internal data sources. Enrichment via “open data” sources is also engaging.
A well-known example is the following. The first table contains all customers with their first names. A second table is a dictionary of first names and includes, for each first name, the gender (available in open data here). By crossing these 2 tables based on the first name, we will be able to guess the sex of the customer.
At this stage or the previous one (data cleaning), it can be interesting to use fuzzy matching to correct errors present here and there.
Restructuring the data
If unstructured data have been used (XML, JSON, pdf), they will be restructured (i.e., put in tabular format).
crédits : Shutterstock
STEP 2: Data storage
Once the collected data has been cleaned, structured, and enriched, it is time to store it in a data lake (or, historically, in a data warehouse).
crédits : Shutterstock
STEP 3: Exploitation of data from the data lake
What would be the use of data if we did not exploit it? That’s the whole point of the last step of the data exploitation cycle.
Data exploitation typically involves:
Data analysis
Data analysis can be done through visualization on the one hand and by identifying performance indicators (KPIs). A good graph or well-designed KPIs will highlight deteriorating processes. A predictive model will often be used to understand why a particular function is deteriorating (and to remedy it). Data wrangling will include the implementation of KPIs for monitoring purposes.
Predictive modelling
The construction of these predictive models involves:
- Feature engineering: this consists of creating the correct variables to obtain accurate and robust predictive models. At the end of this step, we will get an “improved” dataset called CAR or ABT.
- The use of “machine learning” tools (more recently called “AI tools”) that analyze the available variables to obtain “predictive models.” This involves observing recurring patterns in the past and drawing conclusions that allow us to predict the future.
Segmentation
In marketing, we like segmentations. Except that most of the time, they are not based on actual (observed) consumer behavior. This is where data is precious because it can allow you to group customers according to variables you would not have thought of spontaneously.
crédits : Shutterstock
To conclude
We explained the 3 main stages of the data life cycle: acquisition, storage, exploitation. We have put the concept of data wrangling back into the picture.
These 3 steps are not necessarily sequential. Indeed, when executing step 3 (data exploitation), it is widespread to discover:
- that crucial data are missing for the calculated KPIs to be relevant.
- that part of the collected data is corrupted or invalid (e.g., a join that should work for 100% of the lines is performed, and we realize that the join keys are very often wrong, which induces errors in the join and that the join in question only works 20% of the time).
When this happens, it will be necessary to go back to point 1 to collect additional necessary data or improve the extraction process to have better quality data. There are often different teams within a business working in parallel on each of these steps in practice.
Posted in big data.


