I regularly use 4 data preparation solutions: Alteryx, Tableau Prep, Talend, and Anatella. The G2 benchmark lists no less than 40 of them. This article explains why the G2 benchmark is not necessarily relevant and what criteria to use to compare the ETL (Extract – Transform – Load) solutions best suited to your needs.
Summary
- What is an ETL?
- The G2 benchmark criteria
- The most important criteria for choosing an ETL, in my opinion
- Conclusion

crédits : Shutterstock
Introduction: what is an ETL?
If you are reading this article, chances are you know what an ETL is. So, I’ll give you a quick reminder. An ETL (or Extract – Transform – Load) is a data preparation solution. With this type of software, you can
- import data (Extract) from different environments
- work on them (Transform) to make them more qualitative, to enrich them, etc…
- and “send” them (Load) to a new environment after you have prepared them
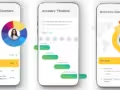
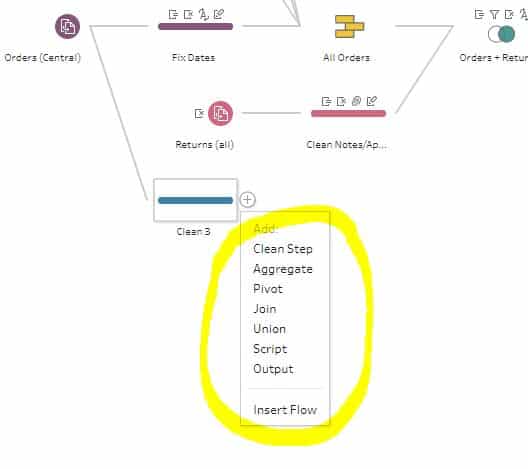
ETL is not in itself a tool reserved for specialists. Most ETLs work on the No-CODE principle, using “boxes” that correspond to particular functionality and linking them together to form a “pipeline.” It’s straightforward and compelling.


I give you some examples of these pipelines above in 4 solutions: Talend, Anatella, Alteryx, Tableau Prep. As you can see, all of them look the same.
So, my definition of an ETL includes the “data transformation” dimension.

crédits : Shutterstock
The G2 benchmark criteria
Let’s now come to the ETL benchmark proposed by G2. For those who don’t know G2, it is a marketplace that collects professional users’ opinions on every type of software imaginable. I think their slogan makes a lot of sense:
Why is it easier to get unbiased information about a $100 hotel room than a $100,000 piece of software?
And indeed, I think it is crucial to have quality information, if possible, objective when buying software. The buyer is often at a loss when faced with a plethora of solutions for the same need.
G2 has a category reserved for ETLs (118 at the time of writing this article) and another for data preparation solutions (about 40). The benchmark has 2 axes:
- market presence
- satisfaction
The map is divided into 4 quadrants which will remind you of the benchmarks proposed by Gartner (the famous “magic quadrants“):
- Leaders
- Contenders
- Niche
- High performers

Frankly, I like the principle of G2, but I wonder if this card is really useful.
First of all, there is a problem with terminology. The 118 tools that are listed in the ETL category are more like “EL.” They allow you to switch from one file format to another. The “real” ETLs that transform data is in the “data preparation” category. I find that this brings a lot of confusion.
Secondly, the segmentation that is proposed does not make much sense for the ETL user. A map should be a decision-making tool. It should allow the user to immediately identify the most appropriate solution(s) for his use. But here, it is a “marketing” view that is proposed, which is not helpful for those looking for a technical solution to a particular problem.
The question is, therefore, to know which functionalities of an ETL are differentiating. This is what I will discuss in the next section.

crédits : Shutterstock
ETL: The most important criteria to choose
First of all, I would like to point out that I do not claim to have the absolute truth. As I said in the introduction, there are 118 tools listed in the G2 ETL benchmark. Nobody knows them all, and a comparison is therefore necessarily subjective.
In the following paragraphs, I will develop the aspects of an ETL that I consider as differentiating.
Criterion n°1: data processing available in the ETL
Seriously, this is THE number 1 criterion I would take into consideration if I had to buy an ETL tomorrow. The more processing functionalities (cleaning, transformation, …) you have available, the less you will struggle to prepare your data. Because the features you need are not available natively, you will have to program them yourself. And as far as I’m concerned, I prefer to use No-Code rather than bother with programming. A concrete example of a handy feature is the fuzzy matching feature. I have compared different fuzzy matching algorithms and approaches in different ETLs, and some are better than others. Having such features “natively” is a significant advantage.
Criterion n°2: speed
I think the importance of processing speed is underestimated. However, as I have shown in this article, the differences can be substantial even on trivial operations like sorting. When handling large files, a lousy ETL can quickly become a hindrance. For me, speed is essential because I often run and reconcile large files and … because I hate waiting.
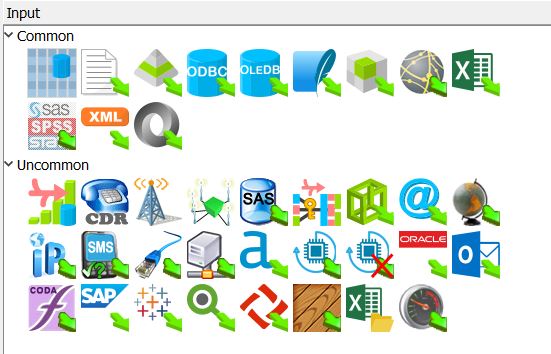
Criterion n°3: number of in and out connectors
More and more connectors are natively embedded in ETLs to serve the most diverse needs. I pay particular attention to the output connectors because, in most cases, I reinject the data into a data visualization solution. For Tableau, exporting to a .hyper file is particularly useful, and for this reason, I particularly appreciate Anatella for complex processing and Tableau Prep for lighter processing.


Criterion n°4: visualization features
It may seem entirely inappropriate to want to do data visualization in an ETL, but it is convenient. When you are doing data mining, being able to visualize data is essential. And if you have to export your dataset every time and open Tableau or Power BI, good luck. In the pipeline below, created with Anatella) you see that I have a box that allows me to call a chart in R. This is very handy because it allows me to see directly what results I can expect.


Conclusion
In the end, I think that the choice of an ETL must be based on objective bases, dictated by the needs of the end-users. Each business context is different, and so are the requirements.
My advice would be to proceed as follows:
- Define the functionalities that will allow users to be more efficient
- Choose a series of tools and test them in a “laboratory” world for a sufficiently long period
- Rate each solution according to its criteria
- Make your choice
This approach seems to be much sounder than relying on a general benchmark.
Feel free to comment and indicate your criteria of choice! Thank you.