If you are manipulating data for analysis or visualisation purposes, you may have encountered this problem before. You need to create a join between 2 databases, but the entries in the reference field are not the same. Differences in spelling, different terminologies, … the reasons are many and varied. During the research that I’m doing to visualise migration flows, I was confronted with this problem. I had to solve it by using an ETL (Extract – Transform – Load) solution managing fuzzy matching. I’ll explain to you how I did it.
Summary
- Introduction
- The problem
- Solution 1 with Tableau Prep Builder (spoiler: it doesn’t work)
- Solution 2 with Anatella (spoiler: it works)
- Conclusion
 Introduction
As part of a personal project on the visualisation of migration flows in Europe, I obtained figures from the European Union (the database has 242500 lines). The database details the number of migrants according to their country of origin and their country of destination. So, on one side, you have about 200 countries of origin, and on the other side about 30 countries of destination. It, therefore, seemed appropriate to me to visualise these flows at a higher level of granularity: the region of origin.
I could have made groups of countries directly in Tableau, but when you have 200 entries, it is tedious (and not necessarily error-free). I preferred to look for a database of the different countries and the “official” region to which they are attached. I found this database on the website of the World Trade Organisation.
The problem
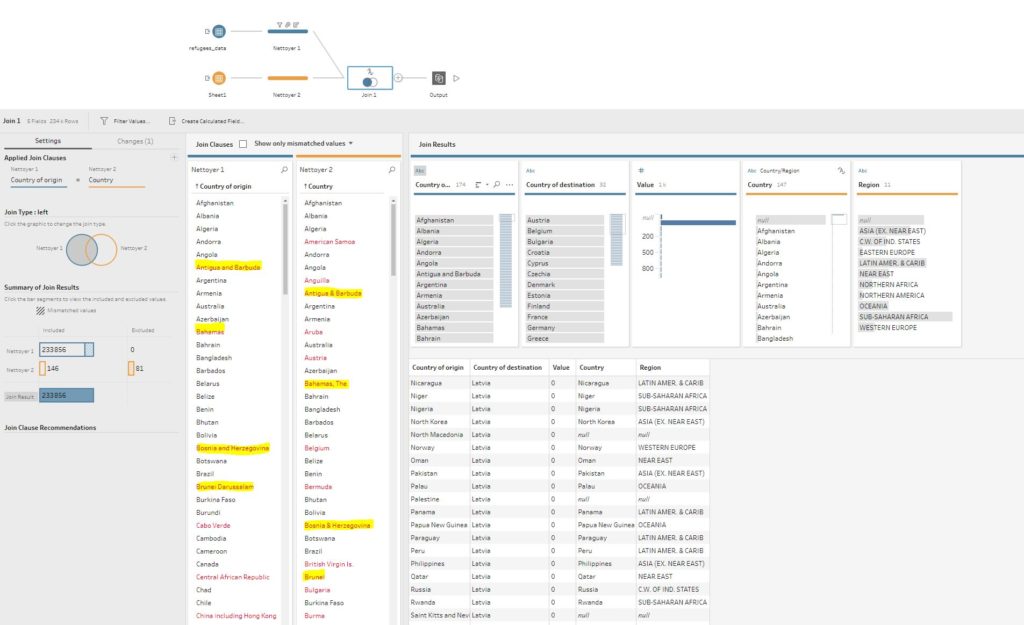
The problem is that a country name is far from being a constant. Here are a few examples:
- “Cabo Verde” in the national language of the country, “Cap Verde” in English.
- “Antigua and Barbuda” in one file, “Antigua & Brabuba” in the other.
- “Bahamas” and “The Bahamas”
- “Central African Republic” and “Central African Rep.”
- “Cook Islands (NZ)” and “Cook Islands”
- “Ivory Coast” and “Cote d’Ivoire”
Before I was hounded by the “search and replace” fanatics in Excel, I was looking for a solution that would be more economical in terms of transformations.
In short, as you will have understood, I could have spent a few hours cleaning my database and having the entries “checked” so that the join could work. But I needed a more elegant solution.

Solution n°1 (the one that didn’t work)
As I intended to visualise my data in Tableau, the first solution I tried was to use Tableau Prep Builder. The advantage of Tableau Prep Builder is that the ETL process is graphical and problems are evident (see below, Tableau Prep automatically puts them in red). I have highlighted in yellow the ones I was talking about above. It remains to be seen if a fuzzy join between tables was possible.
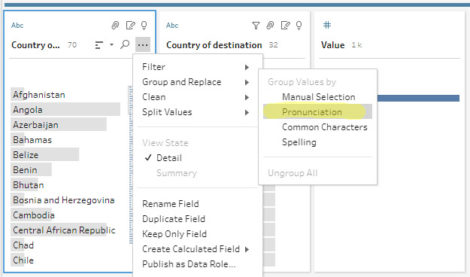
Some research later, I came across this article describing a method of grouping by pronunciation. This option is available here:
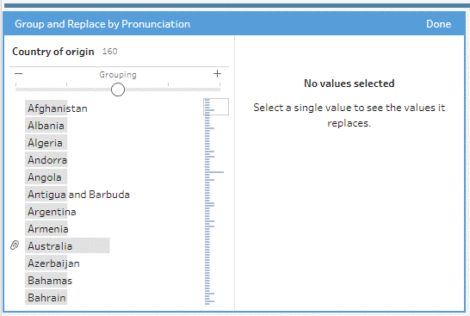
Groupings are useful within the same table to detect variations. Technical explanations are here. The algorithm used is called Metaphor 3 (open source, see here).
The concern is that groupings are only possible on a single table. I should have made a join, then a grouping, and finally a manual deduplication. This is possible when you have a few entries, but the method would not have been scalable.
It’s now time to tell you about the second solution.

Solution n°2 (this one worked!)
To solve my fuzzy matching problems AND to have a scalable solution, I then turned to Anatella.
The advantage of this solution (besides being free for small setups) is that it has a join tool coupled with fuzzy matching. If you know how to work under Tableau Prep (or any other ETL), you should not be out of place. The look & feel is pretty much the same (boxes, arrows, parameters). For me, the significant advantage of Anatella is the richness of the proposed features (+/-300). This is what the set up to solve the problem looks like (click on it to enlarge it).
I’m not going to detail the whole process, but I’ll focus on the essential parts and of course, on the fuzzy matching.
- In step 1 I separate the entries for which the join went well (lower arm) from the entries for which no match was found (upper arm).
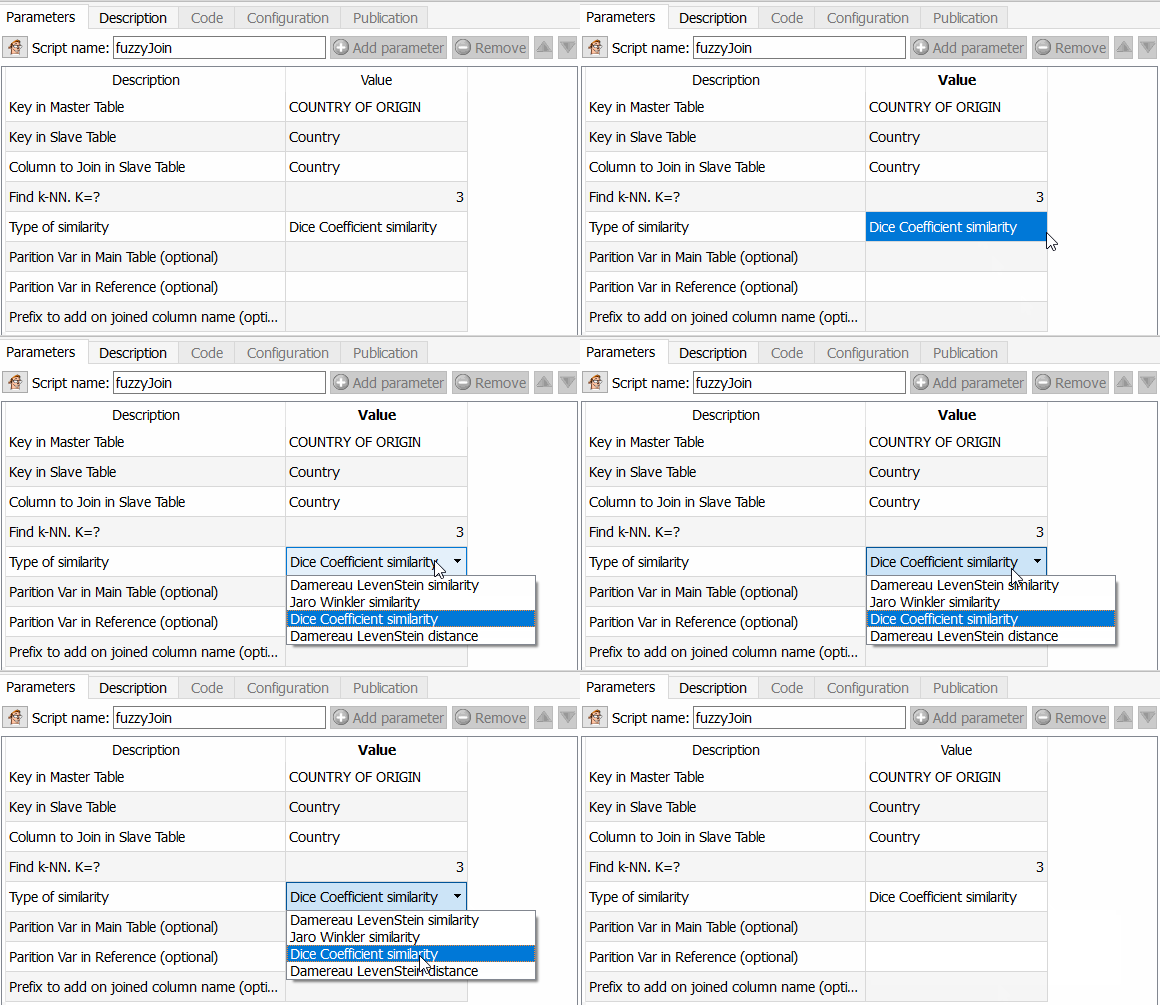
- In step 2, I apply the famous fuzzy matching join tool.
This feature is exciting because it allows you to go much further than Tableau Prep for example, but also than an ETL like Talend. You can indeed choose the algorithm to apply to calculate the similarity between two fields. As Anatella returns the similarity coefficient, all you have to do is choose a threshold and use it. The different algorithms available are Dice’s similarity coefficient, Damereau LevenStein’s similarity method, Jareau Winkler‘s similarity method and Damereau Levenstein’s distance calculation. A comparison of these different methods will be the subject of a specific article.
Another advantage of Anatella is speed. The entire process runs in 14.84 seconds (including fuzzy matching). The join part (up to step 1) runs in 1.58 seconds where Tableau Prep Builder takes 10 seconds.
 Conclusion
To conclude briefly, let’s say that the comparison of the 2 ETLs turned to Anatella’s advantage for my case study (joining 2 tables with Fuzzy Matching). Unfortunately, the phonetic grouping feature offered by Tableau Prep Builder is not adapted to the creation of a join. It can only be applied on a single table and then requires manual filtering operations, which is not scalable.
Posted in big data.
 Introduction


 Conclusion
29 March 2023
Hi Pierre,
How did you manage to get the data in an appropriate format from the Eurostat database? I was also wondering which database you used from the WTO to determine the regions and how you tackled that.
We are looking to do a similar exercise for a course I am attending.
thanks in advance!