Everyone agrees that the content of LinkedIn posts is a determining factor in the probability that they go viral. So today, I’m not going to answer the question “What should we talk about on LinkedIn?” but rather “How should we talk about it?” I used a corpus of 4 million LinkedIn posts to measure the sentiments expressed and analyze the correlation with their virality.
This analysis follows the one I published here on a set of 4.6 million posts and in which I had highlighted the role of the network, the word count, and the number of emojis in the virality of a LinkedIn post.
If you want to know more about LinkedIn and receive my exclusive analyses by email, you have to subscribe to my newsletter (below). Make sure you confirm the subscription link that you will receive by email!
Summary
- Méthodology
- Detailed results
- Sentiment analysis: how does it work?
- Differences in feelings expressed according to the language
- 3 detailed sentiment analyses
- Sentiment analysis of viral posts on LinkedIn
- Prediction model: effect of subjectivity on the virality of LinkedIn posts
The results in a nutshell
- Only 0.21% of posts get more than 1000 reactions
- Between 82% and 89% of LinkedIn posts can be described as “subjective
- Between 71% and 77% of posts on LinkedIn express positive emotions.
- You don’t necessarily have to be positive to be successful on LinkedIn.
- The most viral dataset post (817355 reactions when writing this post) expressed negative emotions.
- Notable differences in emotions and objectivity/subjectivity are noted based on language
- The emotions expressed in a LinkedIn post have no statistical influence on its likelihood of going viral.
- An average subjectivity of 0.5 increases the probability of virality from 3.59% to 5.2%.
Méthodology
- A dataset of 4.6 million LinkedIn posts was used. I prepared the data using Anatella (Timi company) to:
- detects the language of the post (CLD2 algorithm)
- measures the sentiment of the posts in French, English, and Dutch
- The data were then visualized and explored using Tableau, and a predictive model was developed with Modeler (Timi company).
- The number of posts analyzed is as follows;
- English: 2.556 million
- French: 1.108 million
- Dutch: 68876
Detailed results
- Between 72% and 77% of posts on LinkedIn express positive emotions.
- Between 23% and 28% of LinkedIn posts express negative emotions.
- LinkedIn posts in French are on average more positive than posts in English and Dutch
- The emotions expressed only marginally influence the virality of a LinkedIn post (4.6%)
- The virality of the post is mainly influenced by subjectivity (31.7%)
- The maximum virality is reached for posts with
- a subjectivity of 0,5 to 5,55
- a polarity of 0.24 to 0.35
Sentiment analysis, how does it work?
The advent of NLP (Natural Language Processing) has made a range of new tools available. In my favorite ETL software (Anatella), a module has recently been dedicated to sentiment analysis.
The sentiment analysis is based on 2 variables:
- subjectivity
- the polarity
Subjectivity is measured on a scale that usually goes from -1 to 1 or from 0 to 1. In the case of the algorithm used in Anatella, it is [-1;1]. A subjective post evolves from 0 to 1, and an objective post from 0 to -1.
The polarity corresponds to an assessment of the emotions contained in the text. Again, it is measured on a scale of -1 to 1. Negative emotions are between -1 and 0; positive emotions between 0 and 1.
If you want to know more, I would advise this discussion on Quora.
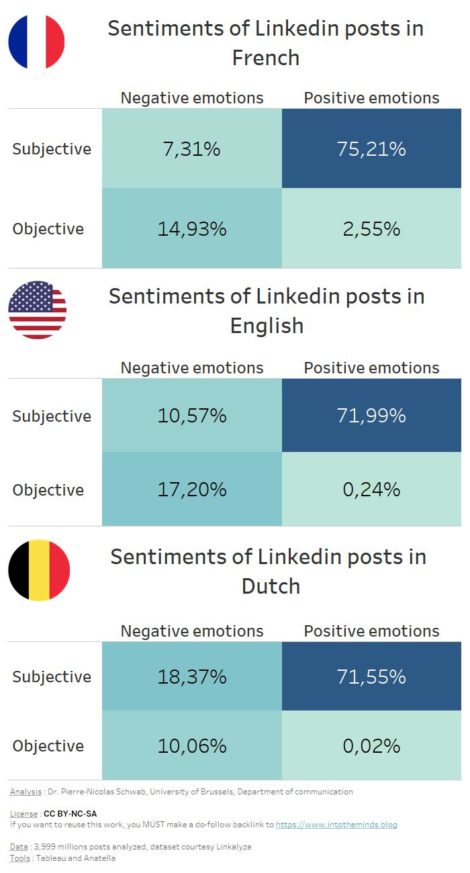
Notable differences in the “tone” of LinkedIn posts depending on the language
In this first visualization, I divided the posts into 4 categories based on subjectivity (negative/positive) and polarity (negative/positive).
As negative subjectivity corresponds to objectivity, I used this term. As the term “polarity” refers to emotions, I have chosen to use this term for a better understanding.
So, we find 4 “quadrants” that allow us to divide the LinkedIn posts according to their objectivity/subjectivity and positive/negative emotions. As you can see, there are significant differences between the different languages (feel free to click on the image to enlarge it).
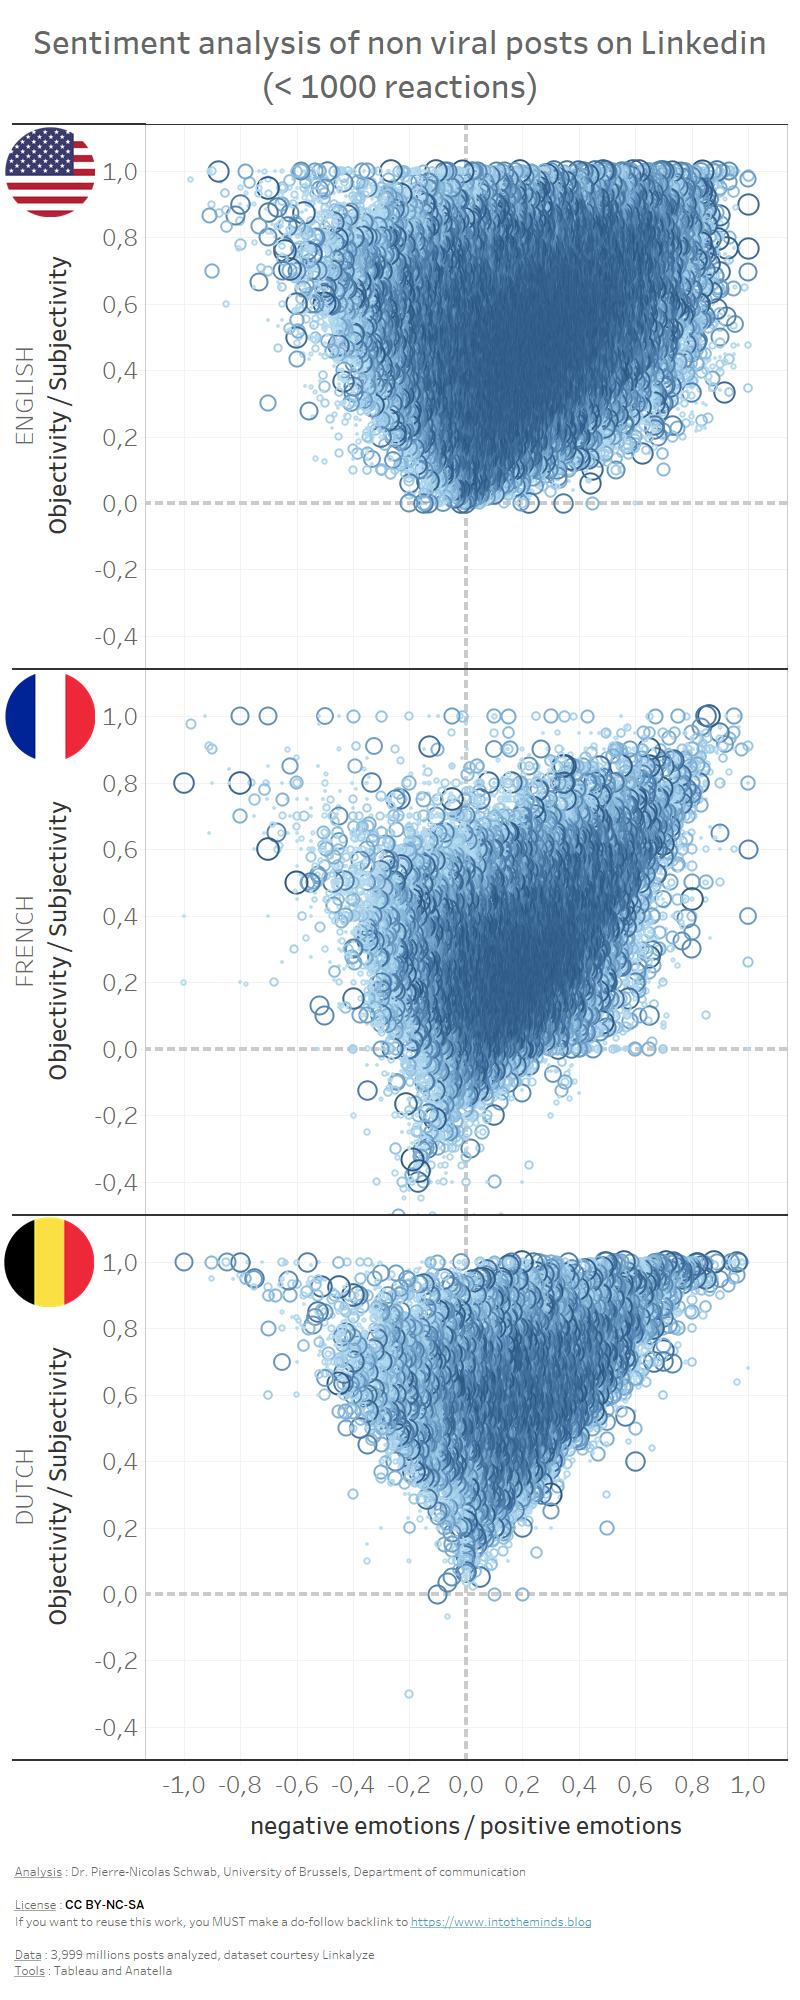
LinkedIn posts are almost always subjective… except in French
The graph below shows the sentiments expressed in the 99.79% of posts that received less than 1000 reactions. You can see that the vast majority of them are in the upper part of the chart, i.e., in the “subjective” part. Only the posts in French are a slight exception to this rule.
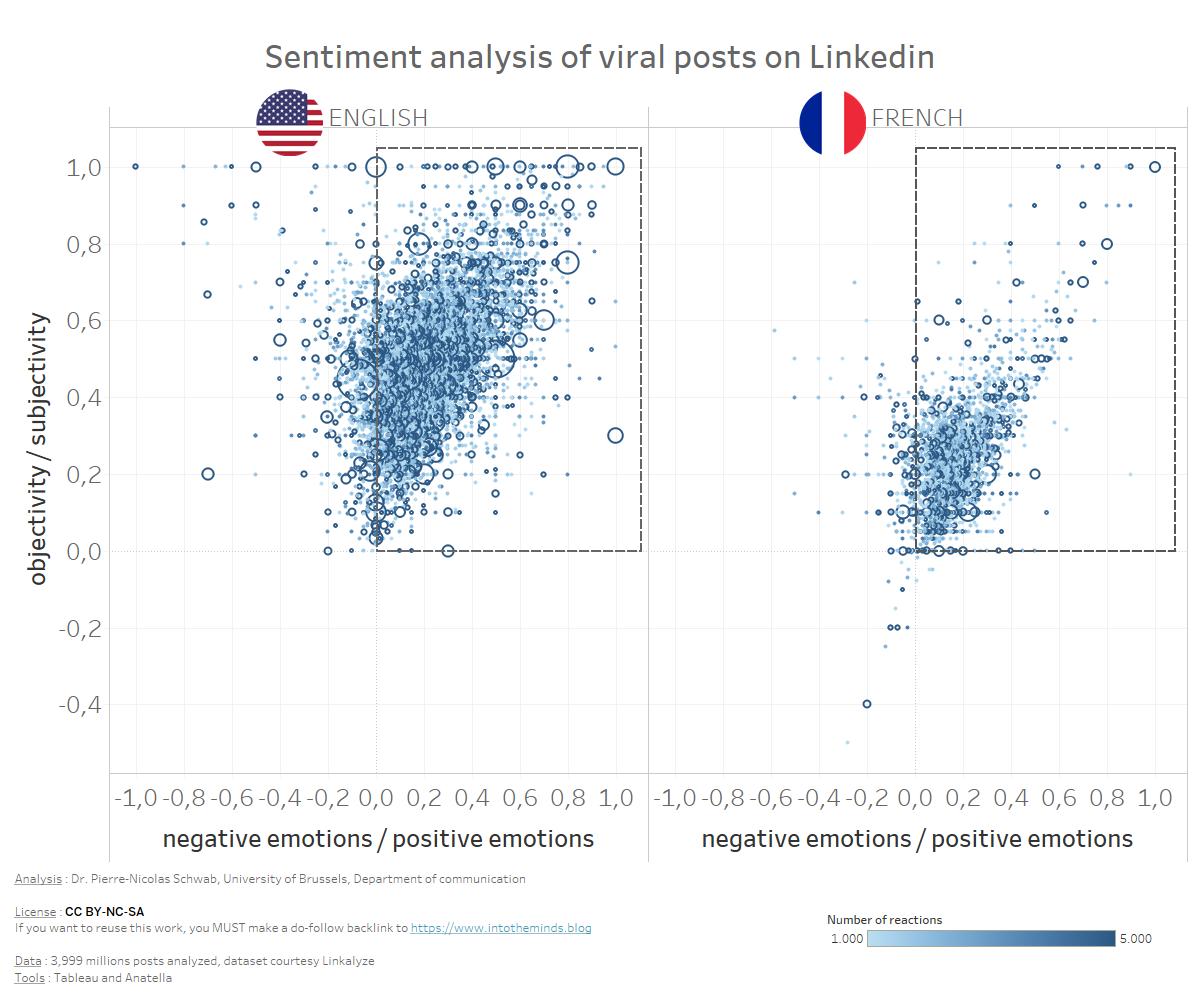
Viral LinkedIn posts are primarily subjective and express positive emotions
The graph below visualizes the LinkedIn posts that generated more than 1000 reactions (likes + comments). Most of them are located, like the non-viral posts, in the upper right quarter (see dotted frame). They are therefore subjective posts whose emotions are positive. However, we note a significant number of posts in the upper left quadrant for the English language, i.e., posts whose expressed emotions are negative. The most viral post of the whole dataset is located there.
The most viral post in the dataset is the work of this person. It is classified as a slightly negative post in terms of emotions and average subjective. I’ll let you decide if the algorithm did a good job. As you can see, since the dataset was provided to me, this post has continued to receive likes and comments. The cumulative number of reactions is now 817355.

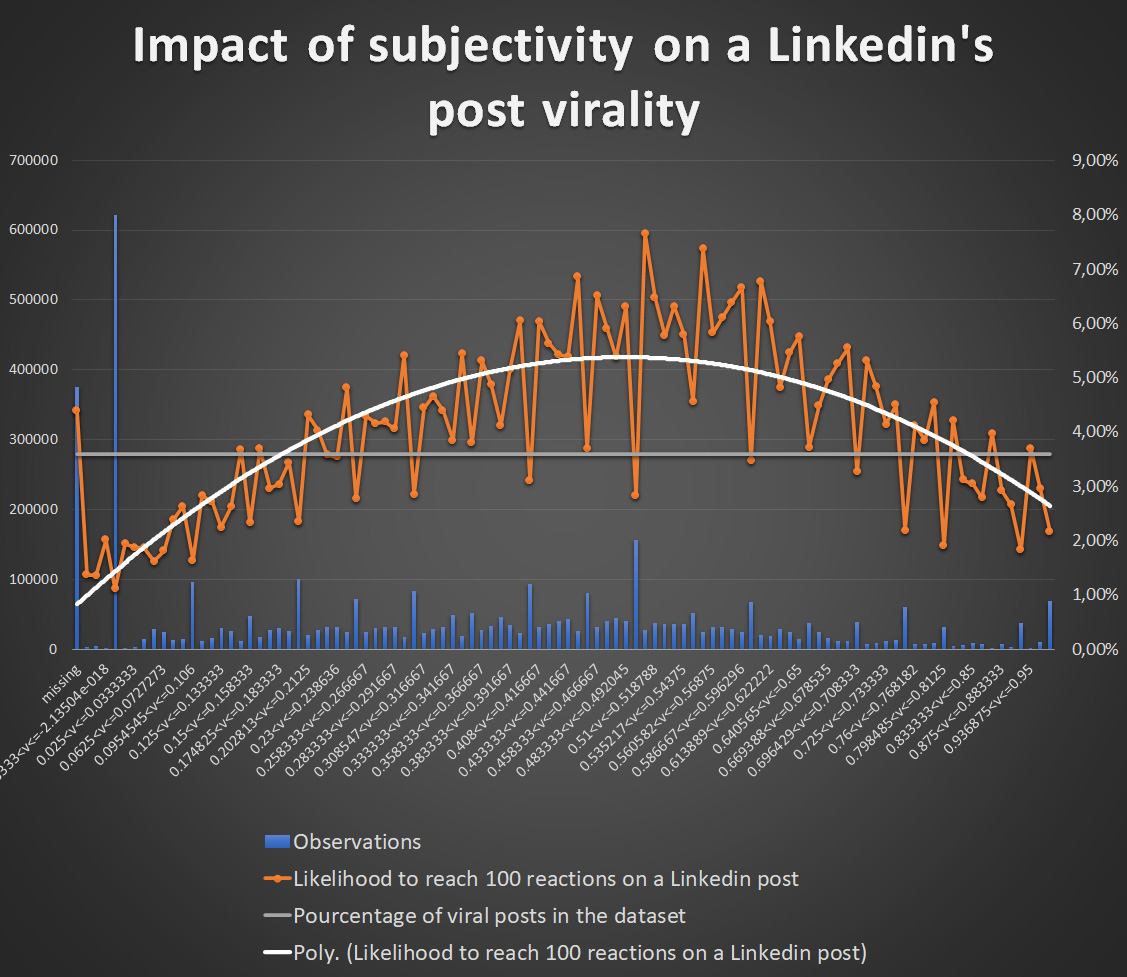
Subjectivity has the most significant influence on LinkedIn post virality
The final part of this analysis was to determine the effect the variables “subjectivity” and “polarity” had on the probability of a LinkedIn post going viral.
The prediction model was realized using “Modeler” from Timi. I followed the same methodology as in my previous research. I modeled the probability of getting 100 reactions to a LinkedIn post. The “reactions” are defined as the sum of likes and comments.
The Timi model shows that subjectivity contributes 31.7% to achieving the goal; the “polarity” variable (i.e., the emotions expressed) is only 4.6%. In other words, the emotions expressed in the post have little effect on the probability of a post going viral.
The “natural” probability of reaching 100 reactions is 3.59%. When the subjectivity of the post is about 0.5, this probability increases to 5.2%.
Acknowledgements
My thanks to Tableau Software for supporting my research.
Thanks to Frank Vanden Berghen and Timi for their help in making Anatella and Modeler available.