
89%. That’s the increase in traffic I managed to generate on our blog during the lockdown period. I’ll explain how in this article. A mix of SEO, time investment and automatic promotion, the results were beyond my expectations.
If you only have 30 seconds
- During the lockdown, traffic on all my sites increased as a result of my actions. In English, this increase was 89%
- I created very long (3000-4000 words) feature articles on particular topics related to the COVID crisis. The publication lasted from 13/04/20 to 11/05/20
- I used LinkedIn to promote my articles to my contacts
- I used my articles to make new contacts on LinkedIn
- Traffic figures from LinkedIn in Google Analytics seem highly unlikely (too low)
- a gain of 26 back-links, of which ten with DA > 30 and 1 with a DA of 91
Summary

Introduction
13 years of blogging. 3500 blog articles written. I might as well tell you that I’ve made a lot of mistakes and I’ve learned from them. The lockdown period has been, despite its difficulties, conducive to reflection on my mistakes. And I’m quite happy with the result. Indeed, I managed to increase the traffic on the site. In particular, the traffic on the English blog has increased by 89%.
The results
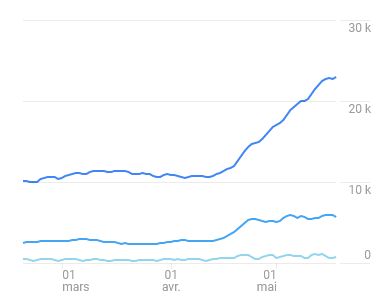
I think the graph speaks for itself (monthly average at the top, weekly in the middle, daily at the bottom).
You can see the increase as of April 15. It is reflected in the daily, weekly and monthly average. It is due to the implementation of a series of articles particularly optimised in terms of SEO which allowed me to collect many backlinks and to rank in less than 48 hours, 1st place on Google in many countries. This increase is perennial, and I still see it today in my statistics of frequentation. They are certainly lower than during the confinement, but 50% higher than before.
The method
The method I used to obtain these results is simple, but I doubt that it is readily reproducible in a context other than that of COVID. Let me explain.
Lockdown has created particular information needs. Also, the lockdown has freed up a lot of time to read and research this information. I tried to understand what people wanted in terms of information and to provide that information as quickly and qualitatively as possible. I published every Monday from 13/04/20 to 06/05/20 a feature article on a COVID-related topic. Once the article was written, I “pushed” it using my LinkedIn network.

Step 1: recognise the need for information
Everybody will tell you that before writing an article, you have to identify the subject, analyse the keywords (with Ahrefs, Moz). I tried with Moz Pro, but the topics I thought of didn’t return any results. So, I did what everyone will advise you not to do: I trusted my intuition. The question I asked myself was simple: what questions do those in lockdown ask themselves? And that’s how I concluded that it was necessary to propose in-depth articles on the impact of COVID by sector of activity. Of course, it would have been impossible for me to write on all sectors of activity. So, I concentrated on what I know:
- air transport – 13/04/20
- food retail – 20/04/20
- non-food retail – 27/04/20
- media industry – 04/05/20
- advertising – 06/05/20
 Step 2: write an “epic” article

The second step was to publish a well-documented feature article every Monday. In the words of Brian Dean (an SEO guru), this meant writing an “epic” article. This is far from obvious, even for someone who has been writing every day for 15 years. It takes a lot of time and ideas to write 4000 words on a subject.
So, I set up phone meetings with experts to get original opinions, unpublished figures, and it worked. Every Monday, I published my various analyses.

Step 3: promote it
For the promotion, I chose to use LinkedIn. Since I wrote on subjects that were within my field of expertise, I necessarily had people in my network who were interested in the topic. So, I sent them by private message a link to my various articles. At the same time, I expanded my LinkedIn network by using Phantombuster and sending my materials to lists of people filtered according to their affinities. Again, it worked well.
As a result: quality backlinks, quality contacts, invitations (including one for a podcast).
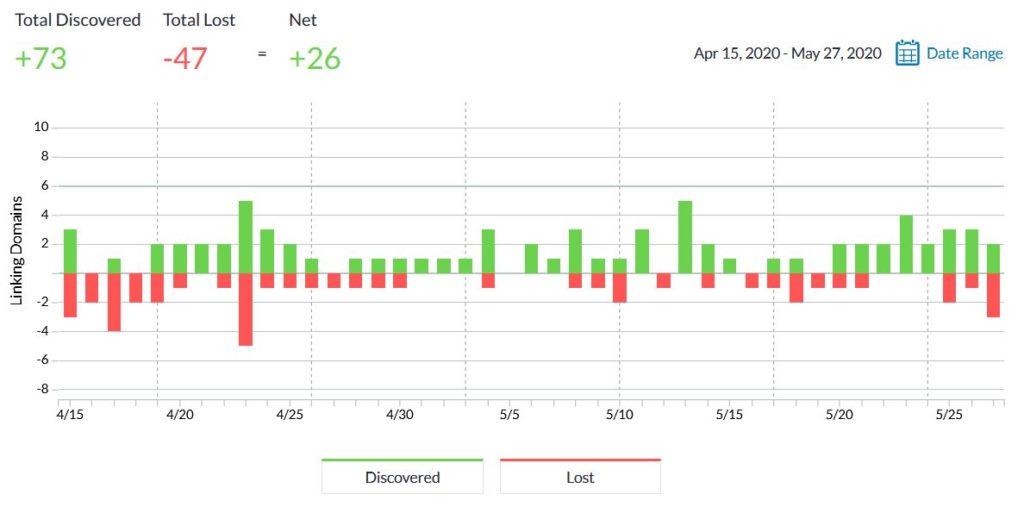
Over the period I gain 26 backlinks, including ten with DA (domain authority) of 30 or more (and one with a DA of 91!). So, I have won the bet.
The LinkedIn contribution
Finally, let’s look at LinkedIn as a source of traffic for your website. As I explained in this article, the LinkedIn algorithm favours discussions within the platform and penalises external links. Since the update of the LinkedIn algorithm, the hyperlink as such is no longer penalised, but the algorithm will not promote the post if users do not spend time interacting with it.
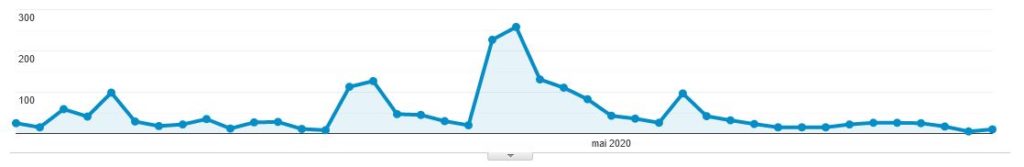
On the graph above, you can see the incoming traffic from LinkedIn. I don’t know if it’s reliable, but in any case, you can see that the figures are not excessively high (1813 unique visitors over the period from 06/04/20 to 17/05/20). There are however interesting peaks on 26 and 27/04/20 (one Sunday and one Monday).
However, these figures make me doubt the quality of the data in Google Analytics. Given the promotion I’ve made of my articles on LinkedIn, it would be surprising to have only 2-digit weekly traffic via this social network. In my opinion, there are some tracking problems (cookies blocked, no tracking of private messages). If you have an idea, don’t hesitate to share it with us.
Images : shutterstock


![Illustration of our post "75% of backlinks come from translations [Research]"](/blog/app/uploads/langues-langages-talen-120x90.jpg)