
 The LinkedIn statistics you find on the internet are often the same: the number of users, geographical distribution, and age … In this article, we offer you 57 new LinkedIn statistics. They are unpublished simply because they are calculated from a dataset that only we have. This is the same dataset that allowed us to unravel some of the mysteries of the LinkedIn algorithm (based on dwell time since 2020) and highlight the 3 factors that explain 55% of the virality of posts.
Check the infographics on the right (it sums up the main results) and feel free to reuse it (Creative Commons Attribution-NonCommercial-NoDerivs 2.0 If you want to reuse this graph, please make a backlink to https://www.intotheminds.com)
Summary: LinkedIn statistics on ….
If you want to know everything about LinkedIn’s algorithm, we advise you to read our research on the subject. They are a little technical but very enlightening for those who want to understand the dynamics of virality on LinkedIn. They will also allow you to go deeper into the topics we cover below.
- The 3 most important factors to make your post viral on LinkedIn
- The role of emojis on virality
- How many hashtags should you put in your LinkedIn posts?
- How large is the ideal LinkedIn post?
Let’s turn to the LinkedIn statistics. We’ve grouped the numbers by broad category.
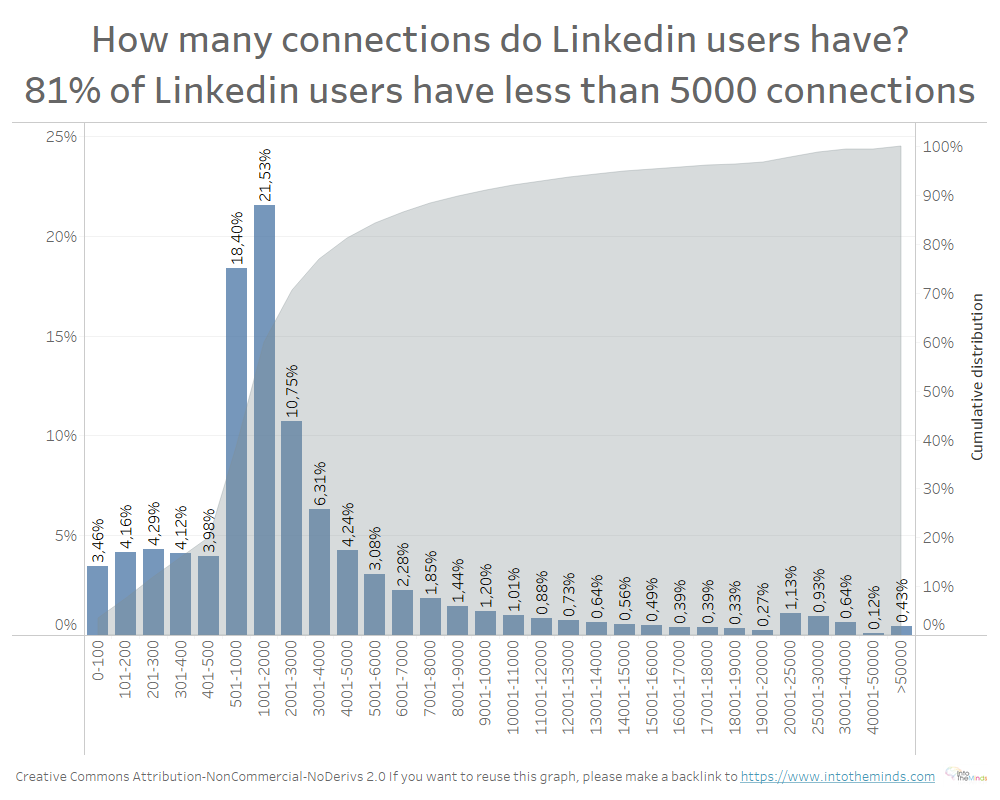
Number of connections on LinkedIn: 8 statistics never published before
- 50% of LinkedIn users have less than 1374 connections
- 8.84% of users have more than 10,000 connections
- 3.21% have a network of over 20,000 connections (source)
- women have an average network size of 3691 connections
- men have an average of 5605 connections
- if we exclude the influencers with more than 30.000 connections, the average number of connections is as follows
- women: 1052
- men: 1604
- The number of connections in your LinkedIn network is responsible for 34% of the virality of your posts (source)
15 General LinkedIn post statistics
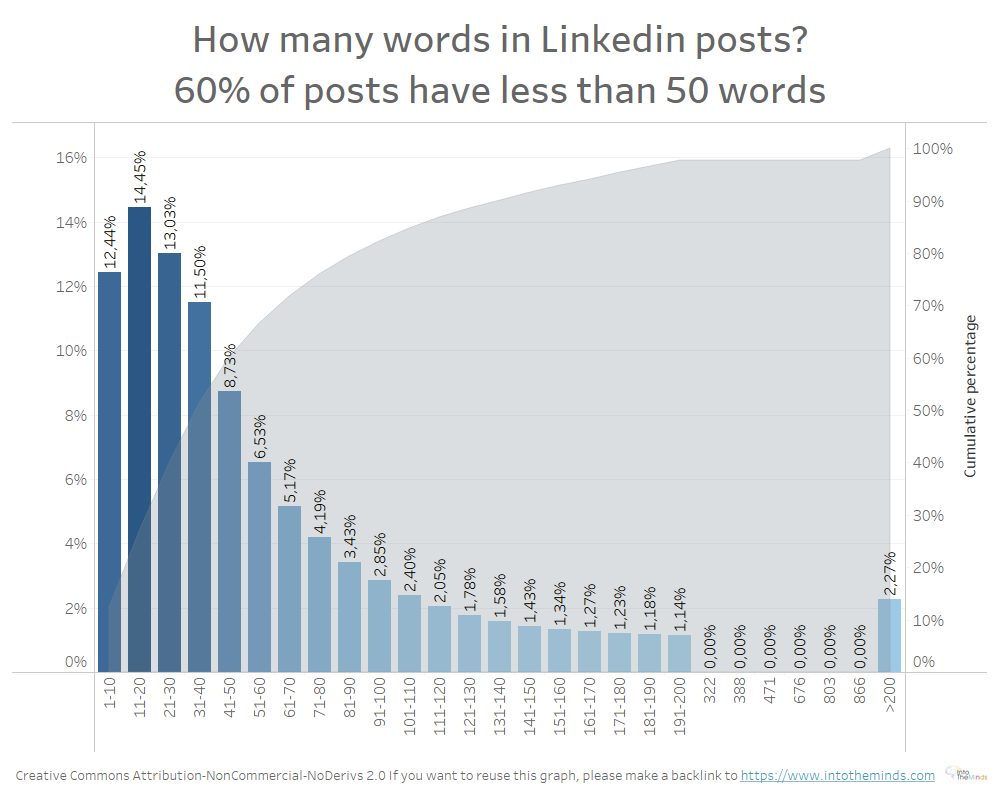
- 57.14 words: the average length of a post on LinkedIn
- 50% of LinkedIn posts are less than 39 words
- 80.3% of posts on LinkedIn are less than 92 words.
- 12.44% of posts are between 0 and 10 words
- 14.45% is the proportion of posts that are between 11 and 20 words
- 17.67% of LinkedIn posts are over 100 words
- 2.27% of LinkedIn posts are over 200 words
- Average post length varies by language
- 78,11 words in Indonesian
- 67.12 words in Italian
- 64.57 in Portuguese
- 61.08 in Spanish
- 57.92 in French
- 57,02 in German
- 55,94 in English
- 44.58 in Turkishc
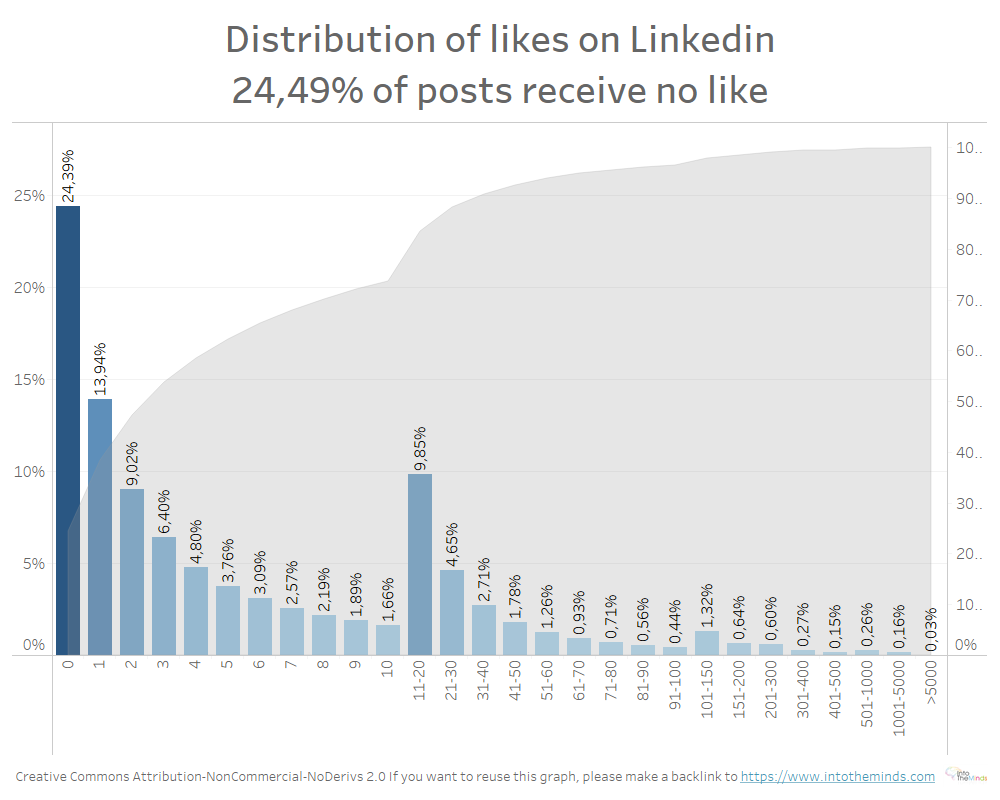
Likes on LinkedIn: 11 new statistics
- the average number of likes per LinkedIn post is 23.81
- 50% of posts receive 3 or fewer likes
- 24.39% of LinkedIn posts receive no likes
- 13.94% of LinkedIn posts receive only 1 like
- 49.31% of posts receive between 1 and 10 likes
- 9.85% of LinkedIn posts receive between 11 and 20 likes
- 26.30% of LinkedIn posts receive more than 10 likes
- 3.42% of LinkedIn posts receive more than 100 likes
- only 0.45% of posts have more than 500 likes
- there is an average of 9.59 likes for 1 comment
- the ratio of likes to comments varies from 15.87 for Turkish to 5.95 for Czech
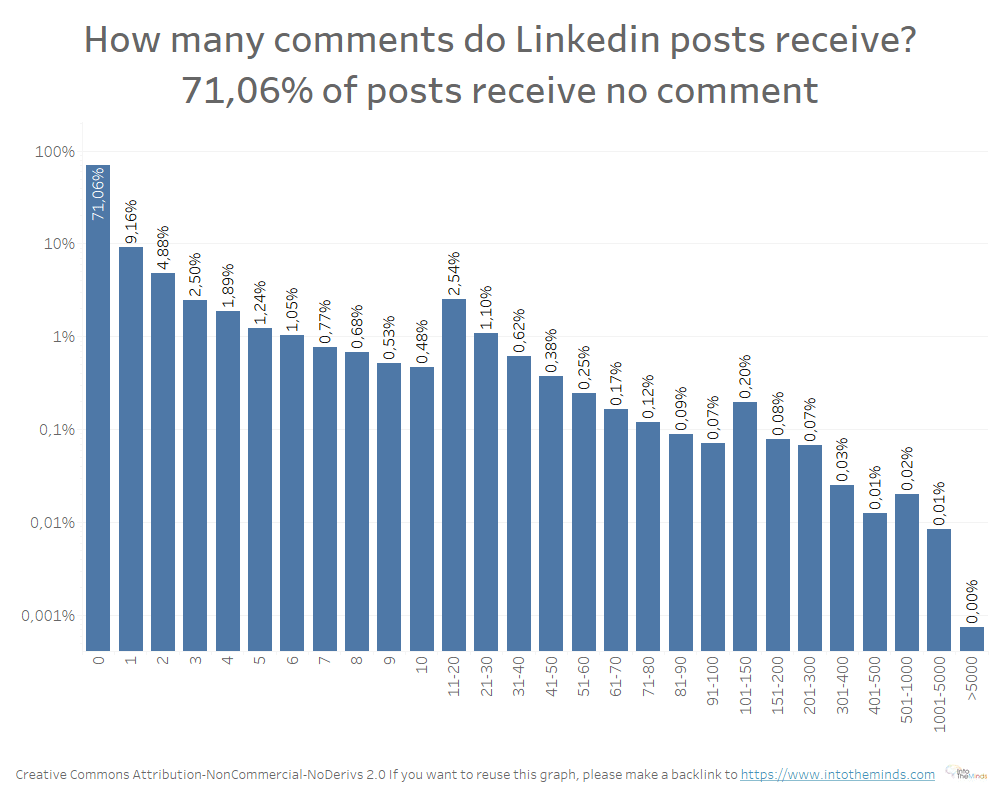
Comments on LinkedIn: 13 interesting statistics
- the average number of comments per LinkedIn post is 3.23
- 71.06% of LinkedIn posts receive no comments
- 9.16% of LinkedIn posts get one comment
- only 5.76% of LinkedIn posts get more than 10 comments
- only 0.41% of LinkedIn posts have more than 100 comments
- the average number of comments varies by language:
- Swedish: 6.42 per post
- Portuguese: 4.20
- English: 3.64
- Spanish: 3.18
- Dutch: 2.89
- Italian: 2.86
- Turkish: 2.73
- French: 2.10
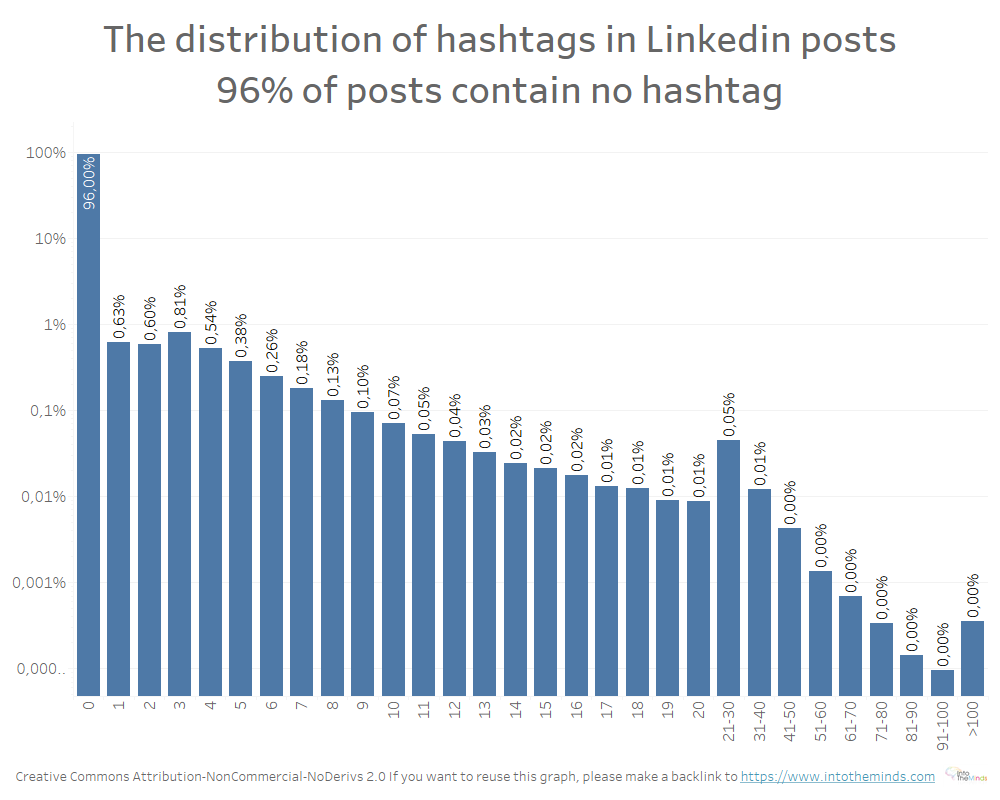
Hashtags on LinkedIn: 4 surprising statistics
- 96% of LinkedIn posts contain no hashtags
- 3.63% of LinkedIn posts contain between 1 and 9 hashtags
- 0.37% of posts contain at least 10 hashtags
- with 1.07%, the hashtag #marketing is the most used, followed by #linkedin with 0.69
For the top 20 hashtags, read this research published in June 2021.
Emojis on LinkedIn: 6 statistics to know
The statistics below were updated in April 2022 based on my 2021 research.
- 0.79: the average number of emojis per LinkedIn post
- 79.96% of LinkedIn posts do not contain emojis
- 10.36% of LinkedIn posts contain 1 or 2 emojis
- 1.28% of posts contain more than 10 emojis
- ? panda is the emoji that has reported the most reaction on LinkedIn (source)
- ? is the most popular emoji; it is used in 5% of posts. In second place is ☑️ (3.37%), and in third place ? (3.30%)
Go to this page to find out the full ranking and see which emojis are the most used according to language.


![Illustration of our post "Free Generative AI Detectors: Which Ones to Choose? [Complete Test 2025]"](/blog/app/uploads/sherlock-holmes-120x90.webp)