In this article, I explain how to use the Gestalt laws to create better data visualization. Each law is illustrated with an example, and I’ve also listed the best practices and mistakes to avoid for each one.

Following on from my article on the worst data visualizations, today I’d like to introduce an essential principle for successful data visualization: the Gestalt principle. The 8 laws of Gestalt explain how the human brain perceives visual elements and can make certain interpretation errors. Understanding the 8 laws of Gestalt will enable you to create “DataViz” that are more effective and more faithful to the reality of your data. If you’d like to delve deeper into the subject, look at my guide to data visualization.
Contact the market research agency IntoTheMinds
There are 8 laws of Gestalt. Rather than spend much time explaining them to you, I will give you some concrete examples.
1. Law of proximity
Objects close together are perceived as a group.
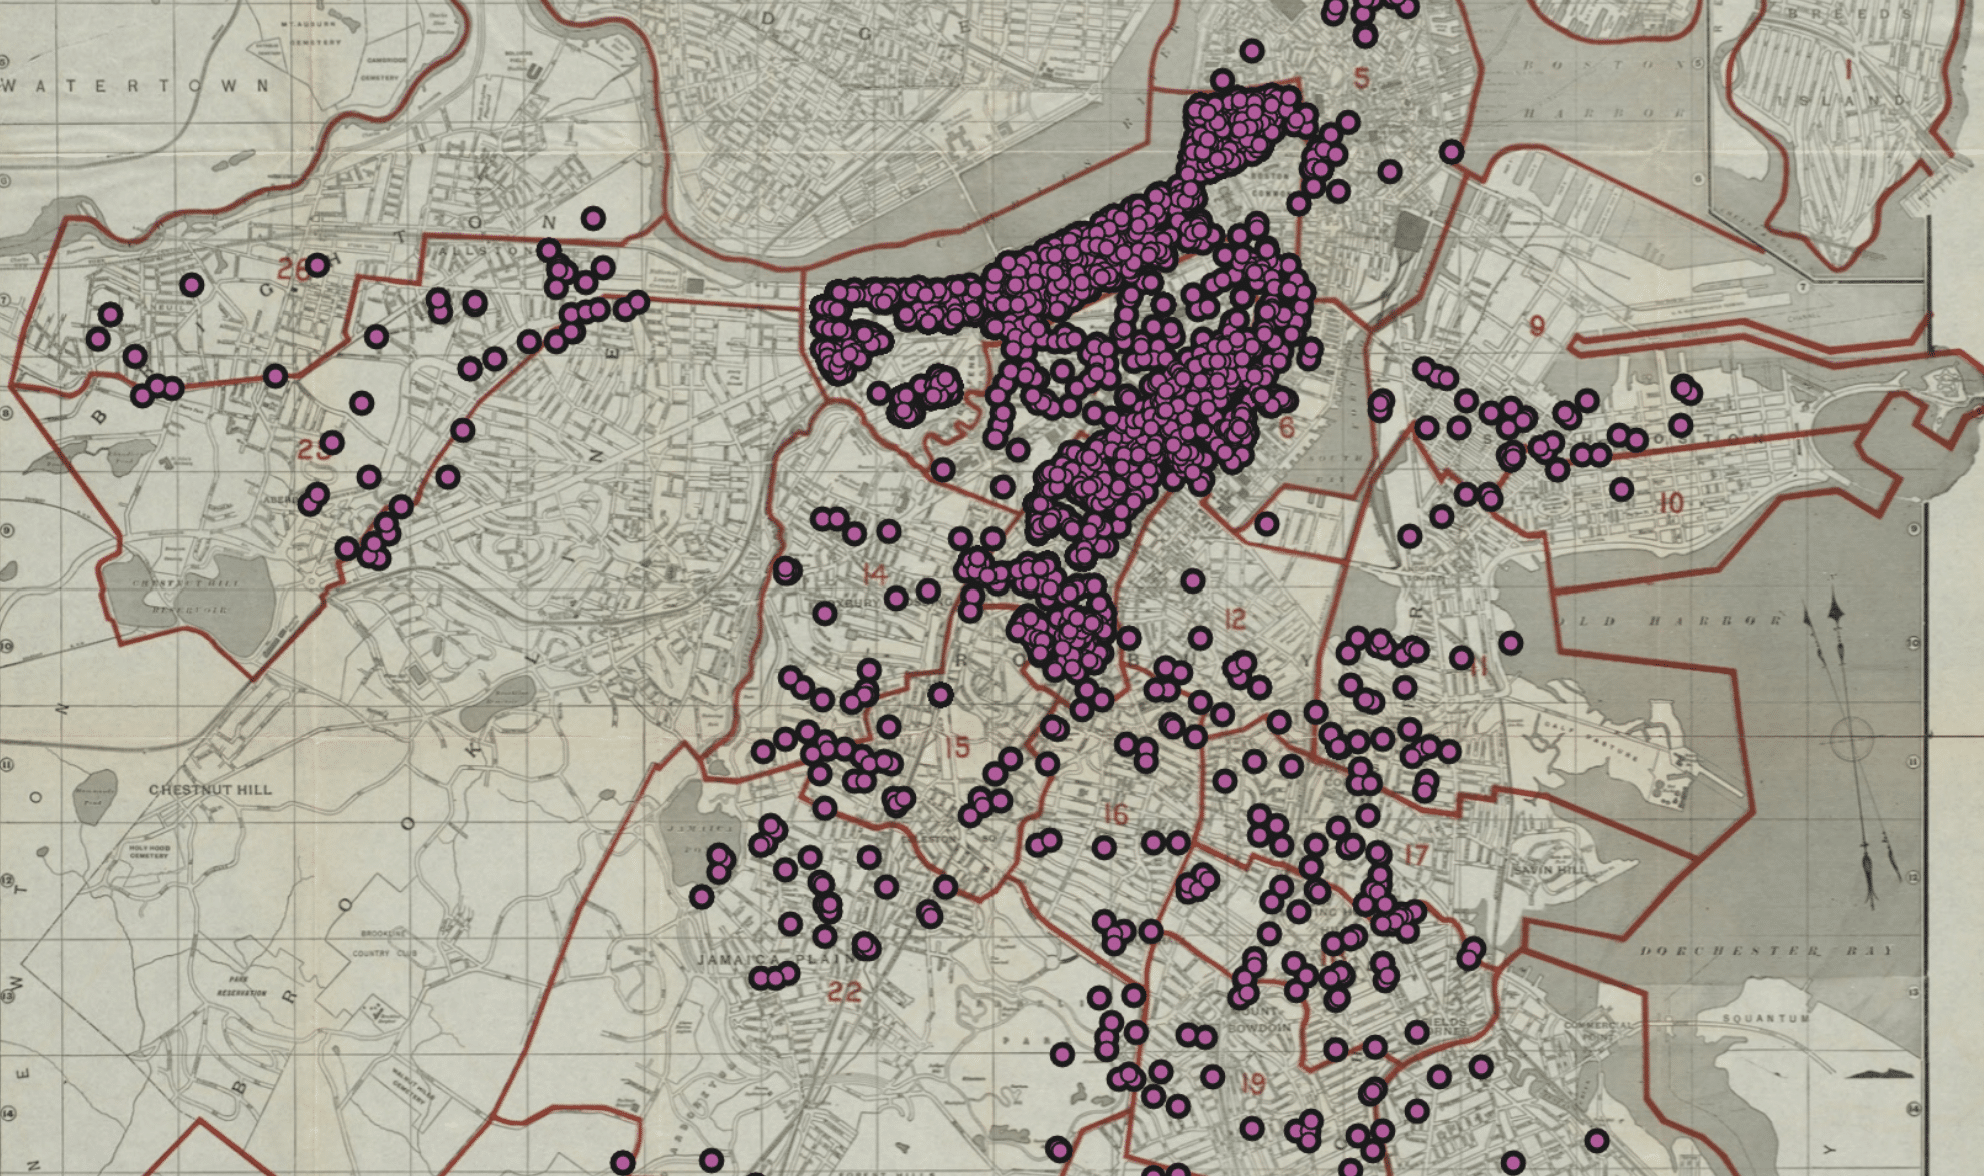
As in the example above (source), displaying points on a map often falls victim to the law of proximity. Your brain will inevitably see 2 groups of dots in the center of this map because the dots are closer together. But there’s no link between them other than geographical proximity. To counter this effect, you can use the law of similarity or segregation.
Good practices
- Histogram: group bars that share a common category.
- Heat maps: this type of data visualization capitalizes on the continuous proximity of display points.
Common mistakes to avoid
- Too many elements: avoid linking too many nearby points together. You could create more confusion than anything else.
- Inconsistent spacing: maintain consistent spacing between groups to keep grouping clear.
2. Law of similarity
The brain will perceive items that resemble each other (because of their color, shape, size, etc.) as related.
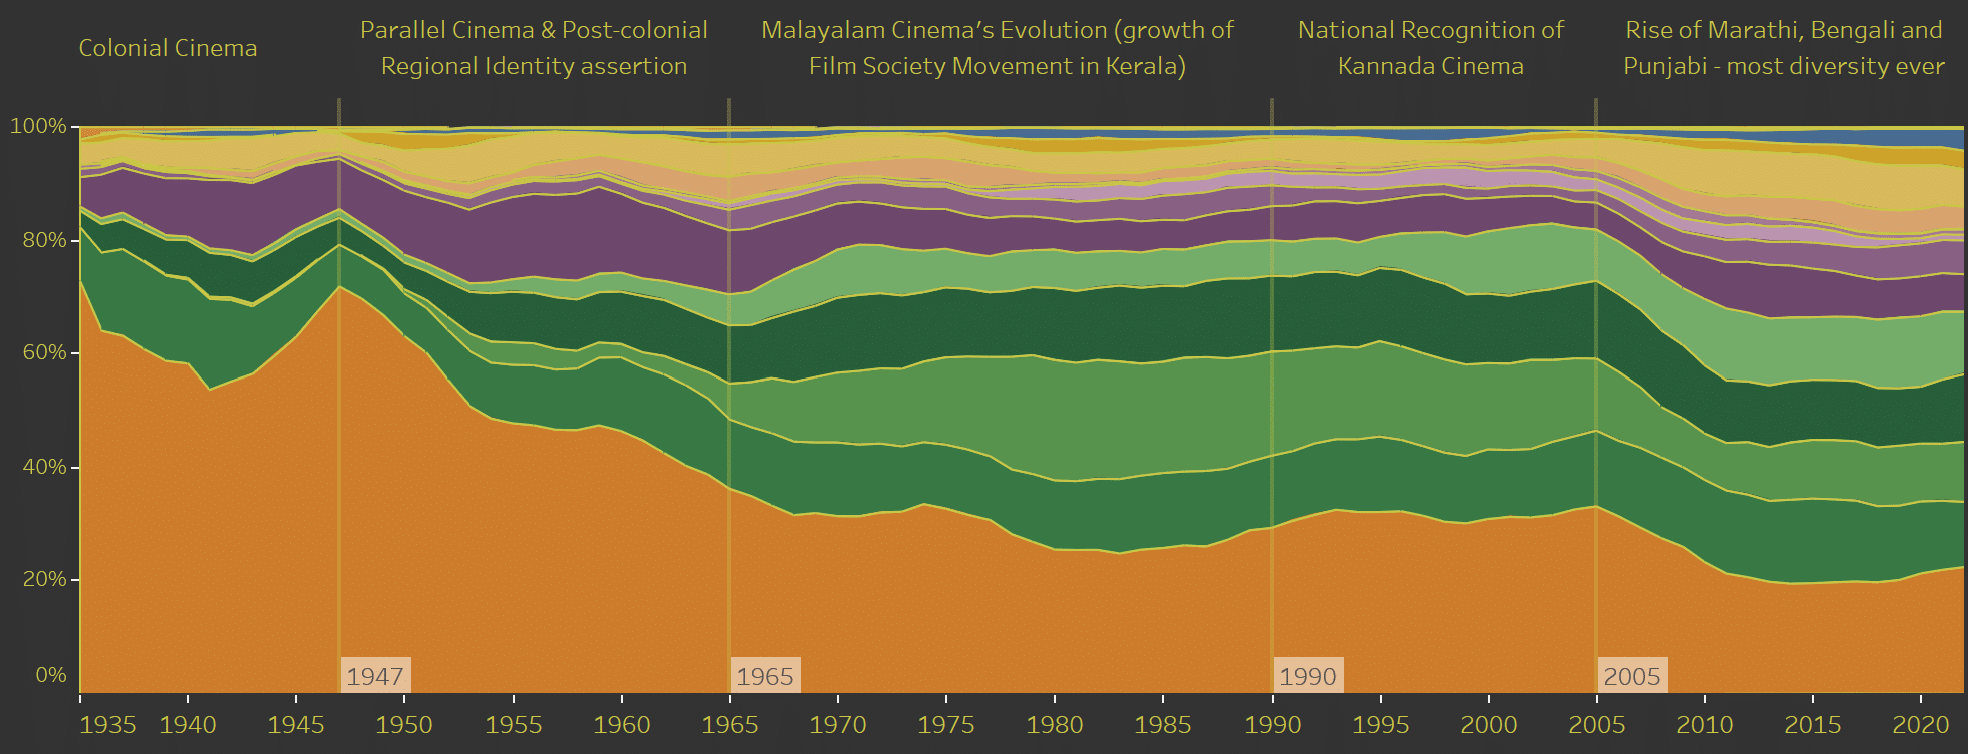
In the DataViz above (source), the author has chosen to represent the use of languages in Indian cinema. By choosing groups of colors, the brain instantly understands that certain colors need to be grouped. The rise of the Dravidian language group (in green) is immediately understood.
Good practices
- Color-coded graphics: use the same color for elements to clarify that they belong to the same group (see example above).
- Line graphs: use similar styles or markers to link points together.
Common mistakes to avoid
- Random use of colors: if you’ve ever seen pie charts in all colors, you know what I’m talking about.
- Too many shapes: when there are too many different shapes, cognitive overload will occur, and the chart will be illegible. Use a maximum of 3 or 4 different markers.
3. Segregation law
Objects positioned within a closed space will be perceived as a group.

In the example above (source), the author has represented a value with circles of varied sizes. Some circles enclose others, misleading the reader into thinking they belong to the same group. This is particularly noticeable with the leftmost “group” in red (“vegetable stock,” “chicken stock,” “beef stock”).
Good practices
- Graphics containing points: use graphic elements (circles, squares, free-form shapes) to bring together points that should be seen as belonging.
Common mistakes to avoid
- Boundaries: clearly define the edges of different data sets and avoid overlapping (see example above).
- Grouping errors: make sure you don’t group data that shouldn’t be grouped. This would distort their interpretation.
4. Law of connectivity
Elements connected by lines are perceived as connected.
In the visualization above (source), your brain tries to form a line between the dots. This unconscious tendency is stronger the closer the dots are together. The contrast between the yellow dots and the dark background enhances the effect.
Good practices
- Flowcharts: you can use arrows linking nodes to suggest a flow in the visualization of a process.
- Line graphs: connect points to show an evolution (but be careful not to link data that is not ordered on a continuous scale).
Common mistakes to avoid
- Too many lines: be sparing. Don’t put 10 lines on the same graph. If you have no choice, there are solutions (highlighting), but this will be the subject of another blog post. 😊
- No visual hierarchy: points should remain visible when a line connects them.
5. Law of common fate (“Common fate”)
Elements moving in the same direction are perceived as part of a particular group.
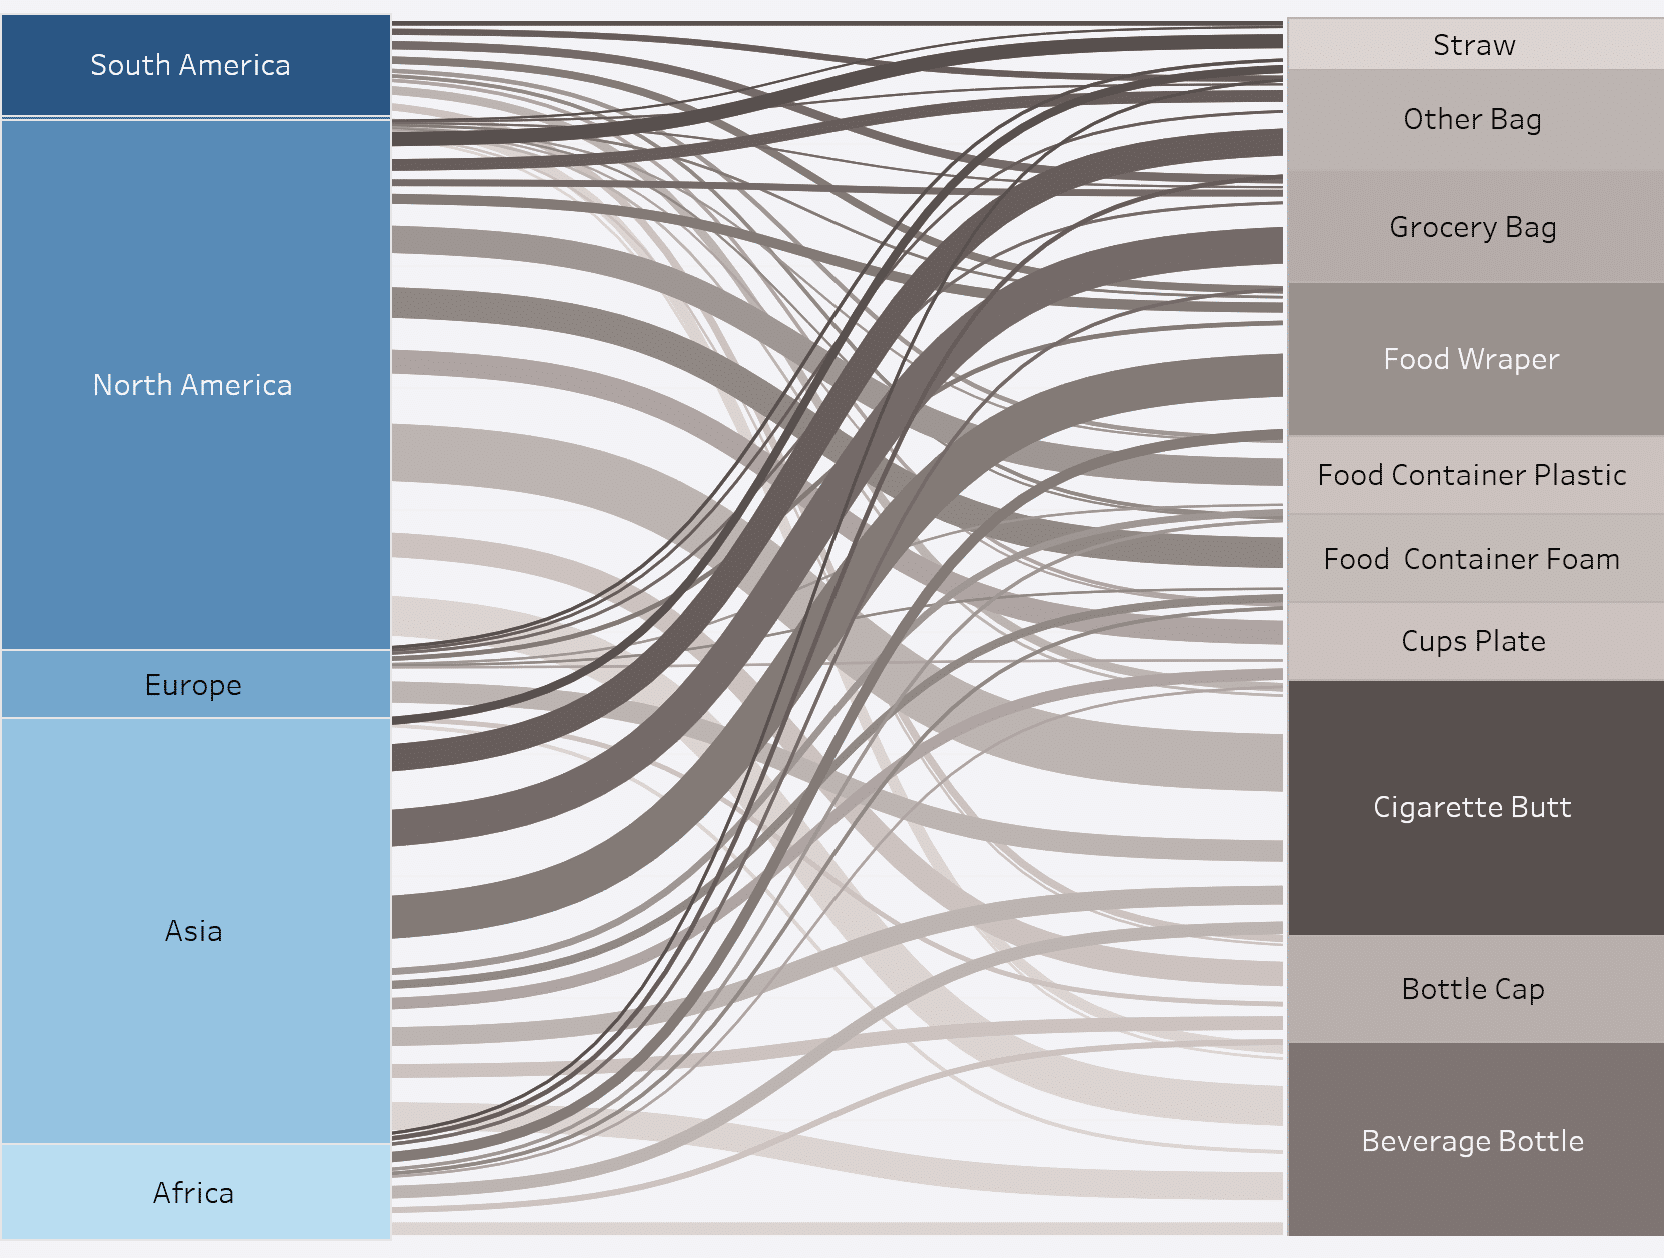
In Sankey’s diagram above (source), your brain will unconsciously associate the 3 “flows” in the middle of the chart as joining points in the same direction (“Asia” on the left, “other bag, grocery bag, food wrapper” on the right).
Good practices
- Multi-series: group lines in the same direction by color or style.
Common mistakes to avoid
- Different directions: don’t mix elements in the same area of your DataViz with elements in opposite directions.
6. Law of closure
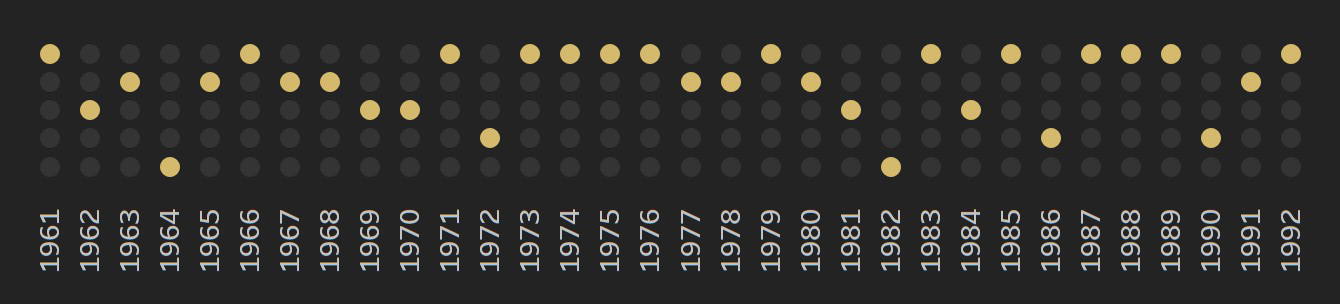
The brain will tend to form sets and fill in “gaps” in the data.
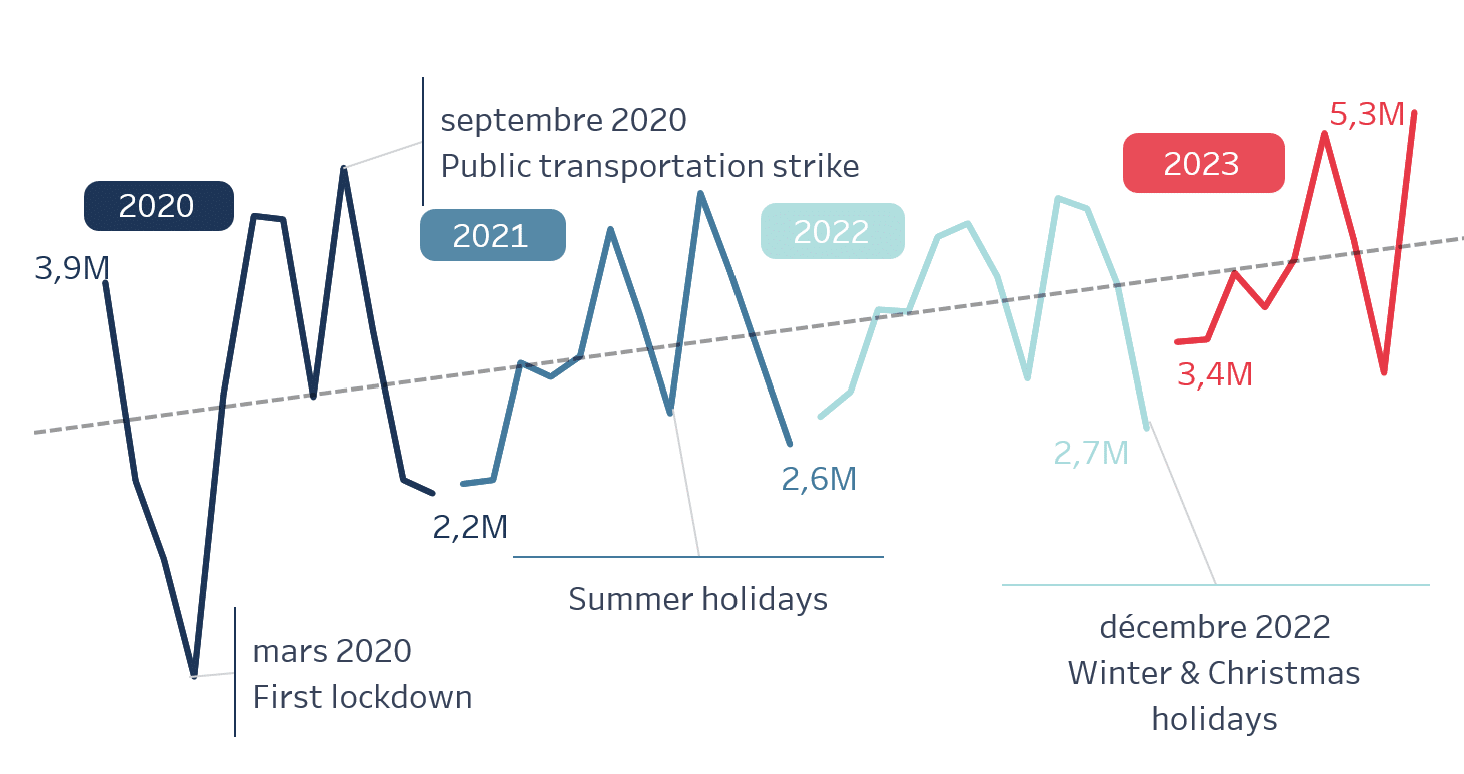
The visualization above (source) shows some gaps between the time series. Our brain automatically fills them in by unconsciously connecting the dots. This also happens with dotted lines, which tend to be seen as full.
Good practices
- Dotted lines: use a dotted line to suggest continuity between points without forcing the user to see a full line. In this way, you remain faithful to the data.
Common mistakes to avoid
- Not closing an ascending line: sometimes, the beginning of a series can suggest that the trend is ascending, whereas subsequent observations prove that it isn’t. If you don’t close the “holes,” the brain may see a trend that doesn’t reflect reality.
6. Figure/ground law
The brain tends to see closed shapes or unity when an object stands out in contrast to the background.
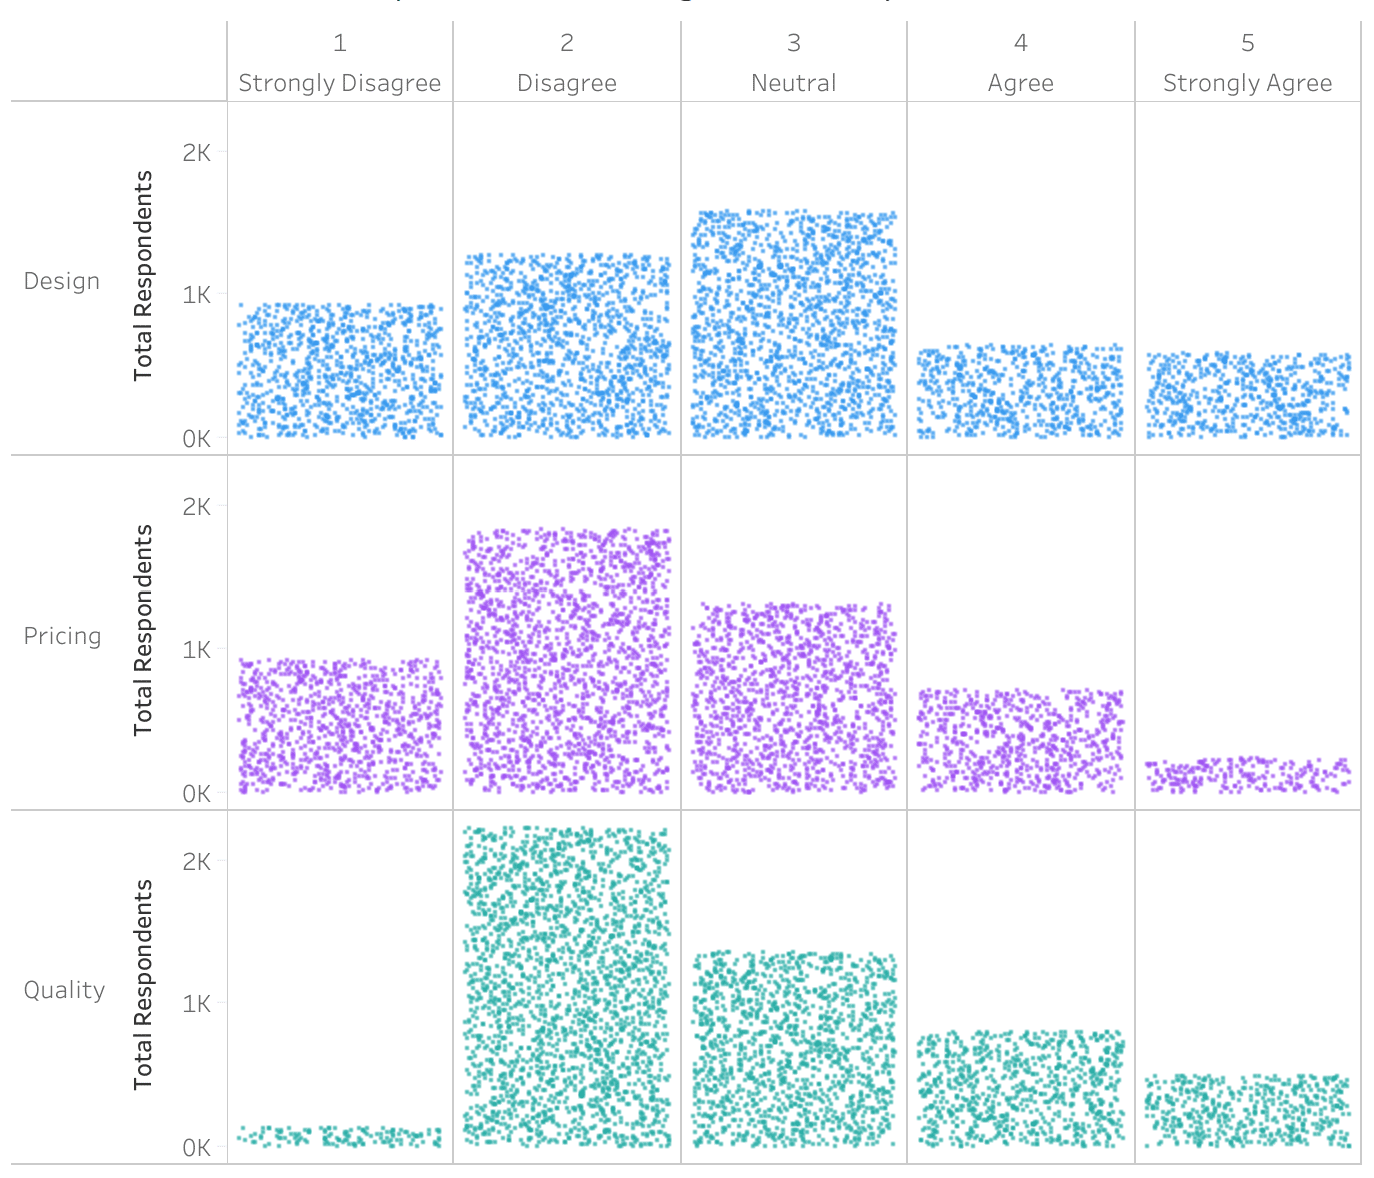
In the example above (source), your brain no longer sees the dots but the shapes within which they are grouped.
Good practices
- Contrasting backgrounds in graphics: to force the brain to see a unit, you can use a sharp contrast between the background color and the color of your data.
- Separate zones in dashboards: you can instantly convey the different nature of your data by creating zones of different hues on your dashboards.
Common mistakes to avoid
- Insufficient contrast: use sharp contrast to separate data from the background. But be careful not to overdo it. The principle of “salience” will work all the better if you highlight only one series of points.
- Overloaded backgrounds: uniform backgrounds are preferable to “decorative” backgrounds. Don’t use images in your backgrounds.
7. Law of continuity
The brain interprets images to avoid abrupt transitions.
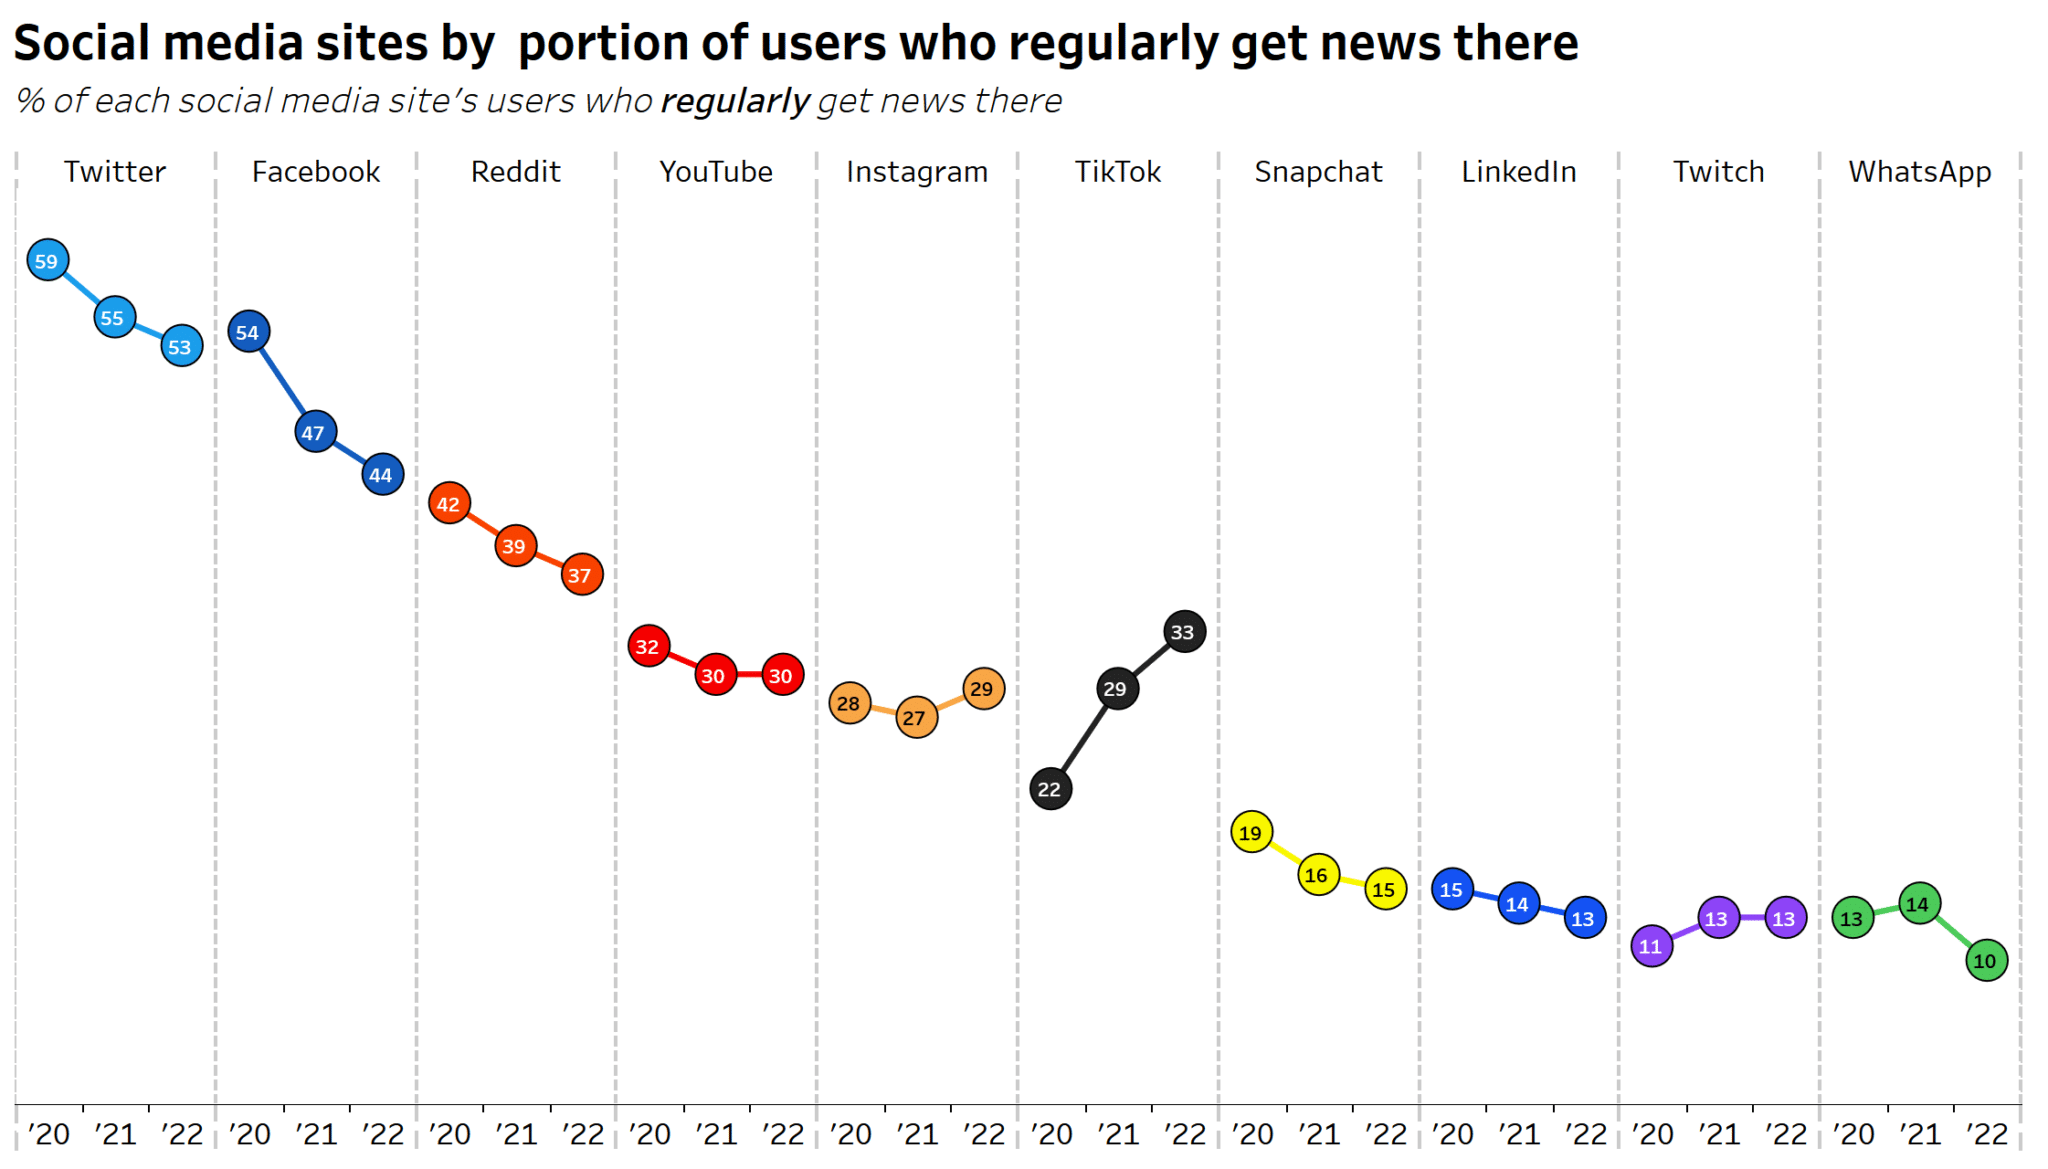
In the example above (source), the brain struggles not to form a continuous line. The series of dots concerning using TikTok (in black) creates a discontinuity. This is interesting for creating a “cognitive dissonance” and attracting the user’s attention. But it can also play tricks on you if the “hole” thus created isn’t big enough.
Good practices
- Line graphs: use smooth curves to connect data points.
- Chronologies: display sequential elements along a line or curve to convey temporal continuity.
Common mistakes to avoid
- Broken lines: ensure that lines are smoothly connected not to disturb the viewer’s understanding.
- Misaligned elements: keep all connected elements well aligned to improve their perceived connection.