
Nineteen years of French statistics on business start-ups and failures in France: this is what we are suggesting that we analyse together today. In this article, we allow you to examine the evolution of business failures, county by county, from 2000 to 2018. After highlighting the most dynamic counties, it is time to explore the dynamics of business destruction.
As usual, we make all our work available to everyone on our Public Tableau space. Feel free to visit it; you can download both the Tableau file and the data sources used.
Table of contents
- Methodology
- The situation has improved since 2000, but not for micro-entrepreneurs
- French counties unequal in the face of failure/creation dynamics
- To go further
Methodology
For this project, we used two data sources provided by INSEE:
- The history of business start-ups by county and by company type. We have used the same data set that we used to create the Sankey diagram presented on our site.
- The history of business failures by county.
This has allowed us to create an index that reflects the balance of failures and creations, the ratio “business failures/business start-ups”.
If you download the Tableau file, you will notice that we have reworked two additional datasets. The population dataset allowed us to calculate the creation rate per inhabitant. The one on income will be exploited later.
The situation has improved since 2000, but not for micro-entrepreneurs

One thing that we have learned from our study is that the situation has been improving steadily for the French economy since 2000. Indeed, the ratio of business failures to business start-ups is consistently declining overall. The proportion had logically increased again in 2008 before reaching a low in 2010 and gradually rising until 2015. In the long term, however, the trend is clearly towards improvement.
Nevertheless, we can see that the situation differs according to the type of company. On the graph opposite you can see, for example, that if the ratio decreases well for companies in general, it increases for micro-entrepreneurs. The dynamics are therefore fundamentally different, and it can, therefore, be concluded that the situation is deteriorating for micro-enterprises.
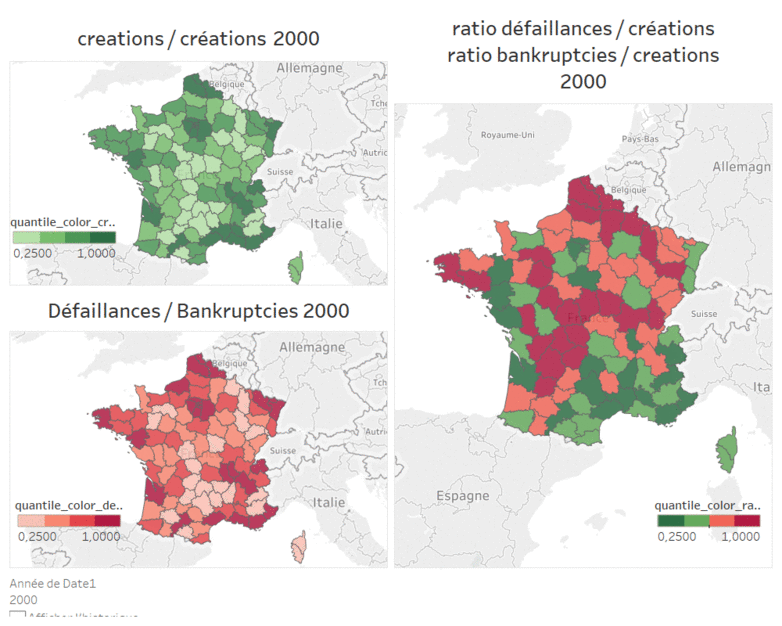
Not all regions are equal in terms of business failures

A representation by quartile makes it possible to understand the dynamics inherent to each region. For creations and failures (example of the failure situation in 2018 opposite) you can see that roughly speaking, the French counties remain more or less in the same quartile over time.
The “failures/creations” ratio gives an entirely different picture of the situation. If you look at the illustration below, you will see that the variations are much more abundant. I invite you, for example, to observe the spectacular turnaround in the North.
Read further
If you wish to go further in your understanding of the entrepreneurial dynamics in France, we remind you that we have devoted two other articles to data mining:

![Illustration of our post "SIAL 2024: 12 tips to organize your visit [Guide]"](/blog/app/uploads/sial-2018-etude-de-marche-france-alimentation-1-120x90.jpg)