In our last post, we presented you with a map representing the French counties where the most (and least) companies are created. This analysis, as impressive as it may be, needed to be further developed to take into account the disparities that exist in terms of population density. A region with a tiny population will necessarily create fewer companies than a large city (let alone a capital). It was, therefore, necessary to take into account the people in each county to put the number of new businesses into perspective.
In today’s article, we, therefore, suggest that you read through this analysis and discover with us the territories in metropolitan France, where the entrepreneurial spirit is most dynamic.
To learn more about our data mining and business intelligence services, visit our website.
Methodology
We continue with the same data set (that of INSEE) that we have this time enriched with census figures by county. A quick connection to Tableau and the job is done.
A field calculated “number of inhabitants/number of companies created” has been set up, which will be used following our analyses, especially when it is necessary to create the representation by quantiles.
Analysis 1: How is business creation evolving at a national level?
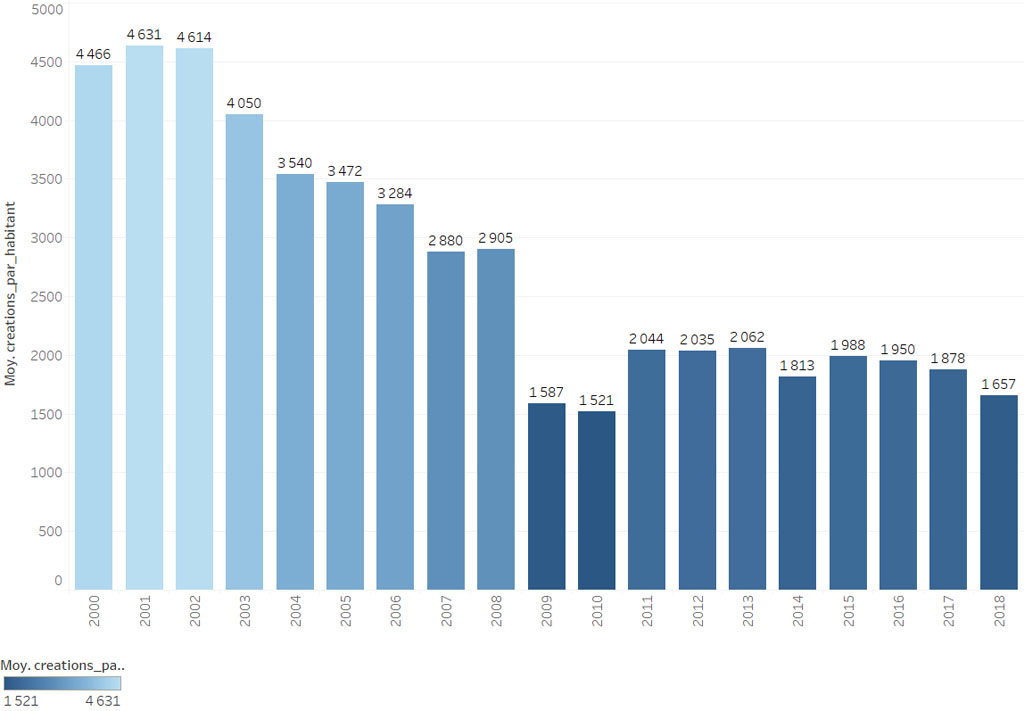
The first lesson can be seen in the graph below. You can see the evolution of the dynamics of business creation per number of inhabitants from 2000 to 2018.
In 2000, a company was created per fraction of 4466 inhabitants in France. This ratio increases in 2001 and 2002 and then decreases steadily. Undoubtedly, the bursting of the internet bubble will have cooled many, and it will have taken several years to rekindle the enthusiasm of budding creators.
The launch of micro-enterprises in 2009, marks a turning point. We see that the ratio is falling sharply, proof that the French were waiting for this new status. Since 2009, after a “technical” recovery in 2011 (the most eager project leaders probably created their company first), we have seen a stabilisation. A company is established in France per fraction of 1950 inhabitants on average, which is a very marked improvement compared to the pre-2009 period.
Analysis 2: Which counties are the most business-oriented?

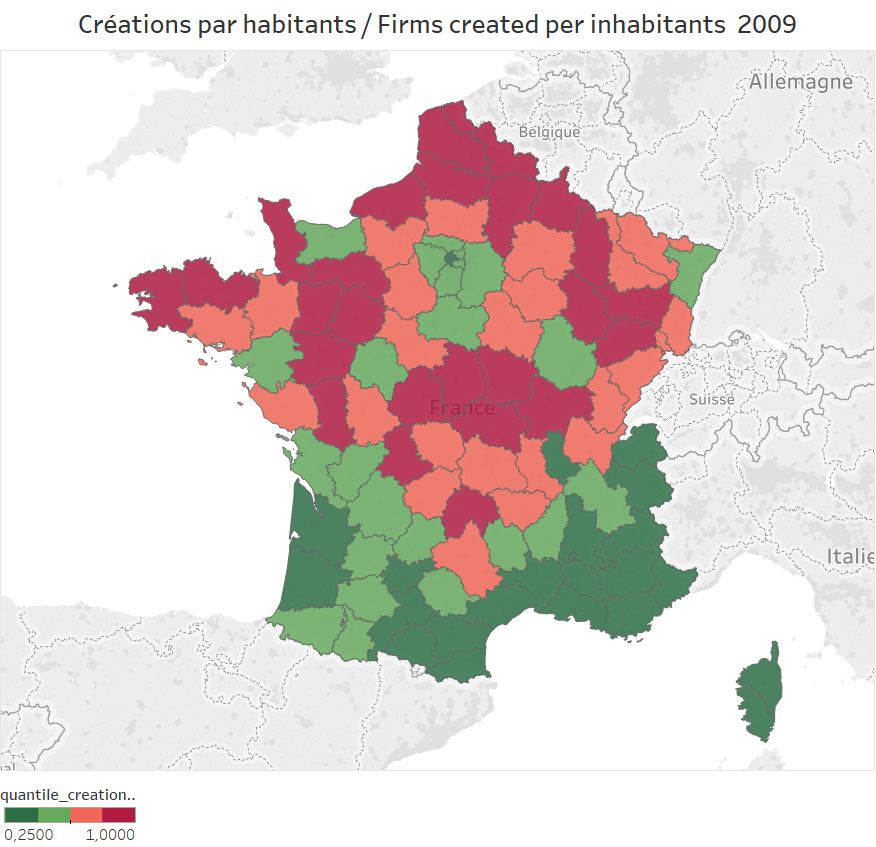
As we explained in our previous post, the use of a colour gradient does not allow us to understand territorial dynamics. It is necessary to use a quantile visualisation.
In the visualisation opposite, you can see how the different counties of metropolitan France are classified. The counties in green are those where the ratio is the most favourable, that is to say where the number of inhabitants per company created is the lowest. As an example, here are two values for 2009. In Paris, a company was established for 1194 inhabitants. In the Pas-de-Calais, it was a company for 4713 inhabitants. Logically, Paris is green and Pas-de-Calais red.
Analysis 3: How the entrepreneurial spirit has evolved between 2000 and 2018
My title is voluntarily a little “catchy”, but I will assume it. The idea here is to look at how the dynamics of creation by population fraction evolved between 2000 and 2018 in the different French counties.
Contrary to my previous analysis, this time, we see that the lines are moving and that some counties are discovering a new entrepreneurial spirit. Look, for example, at what is happening in the North. While Pas-de-Calais remains at the bottom of the ranking, the North seems to be changing.

I hope you enjoyed this analysis. Feel free to comment on this article or ask me for further analysis.