If you need to realise market research in the financial sector or on more generally on a B2C market, the data below may be of some help. I compiled data on credit card ownership in Europe to better understand the dynamics of this market and complement the article I wrote on payment methods used in Germany (by the way, did you know that for the first time Germans have not been using cash predominantly for their purchases in 2018: it seems they are slowly but surely converting to debit and credit cards).
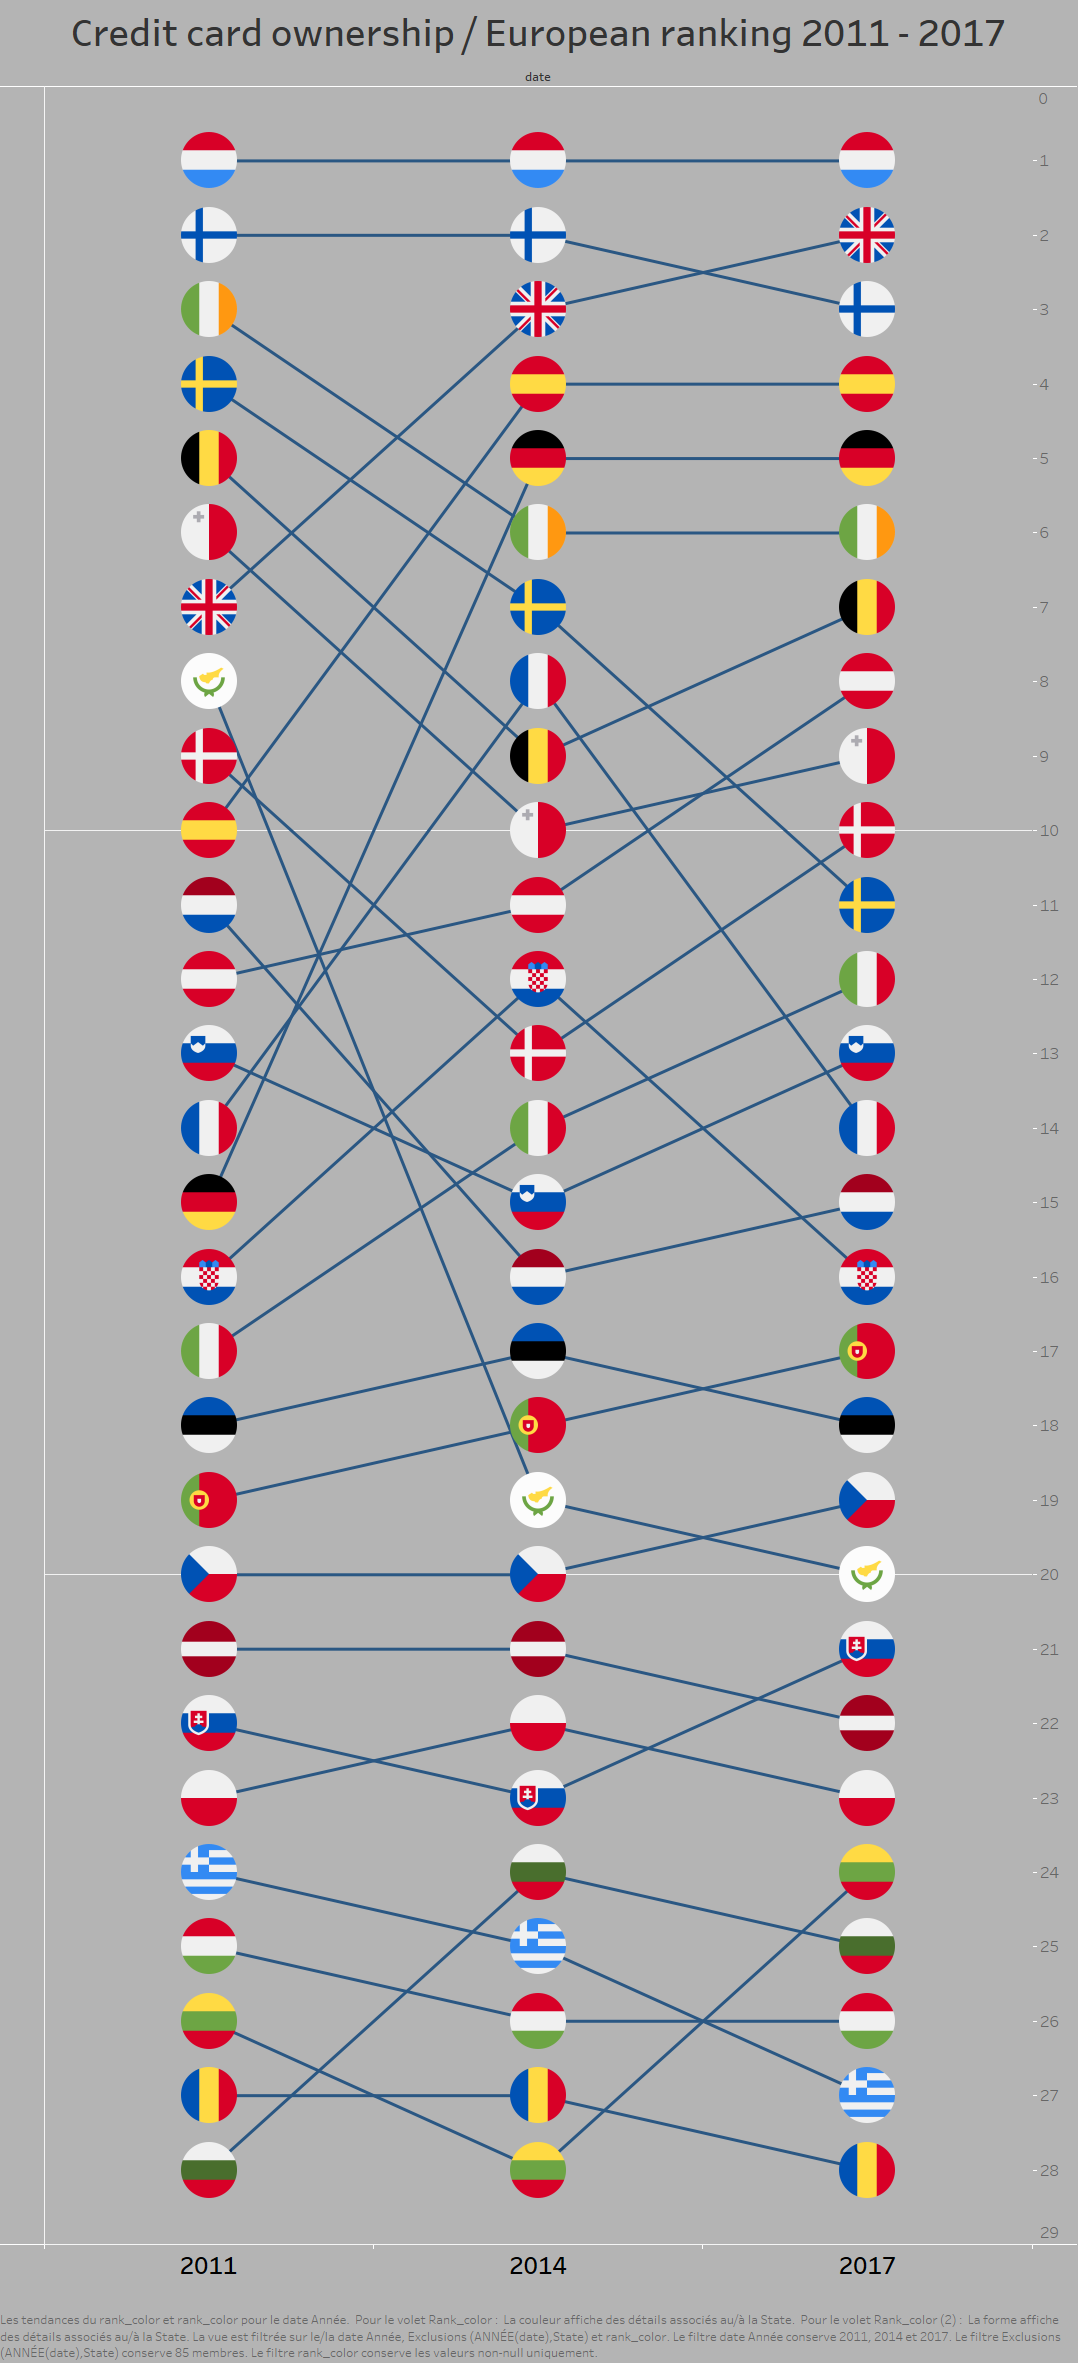
I used data from the world bank (source) and compiled it in Tableau. I was inspired by this excellent tutorial to display the evolution of the rankings by year (although this would have looked much better if I had had data for more than 3 years). I also compared the averages by country with a quantile analysis (quantile analysis based on this tutorial).
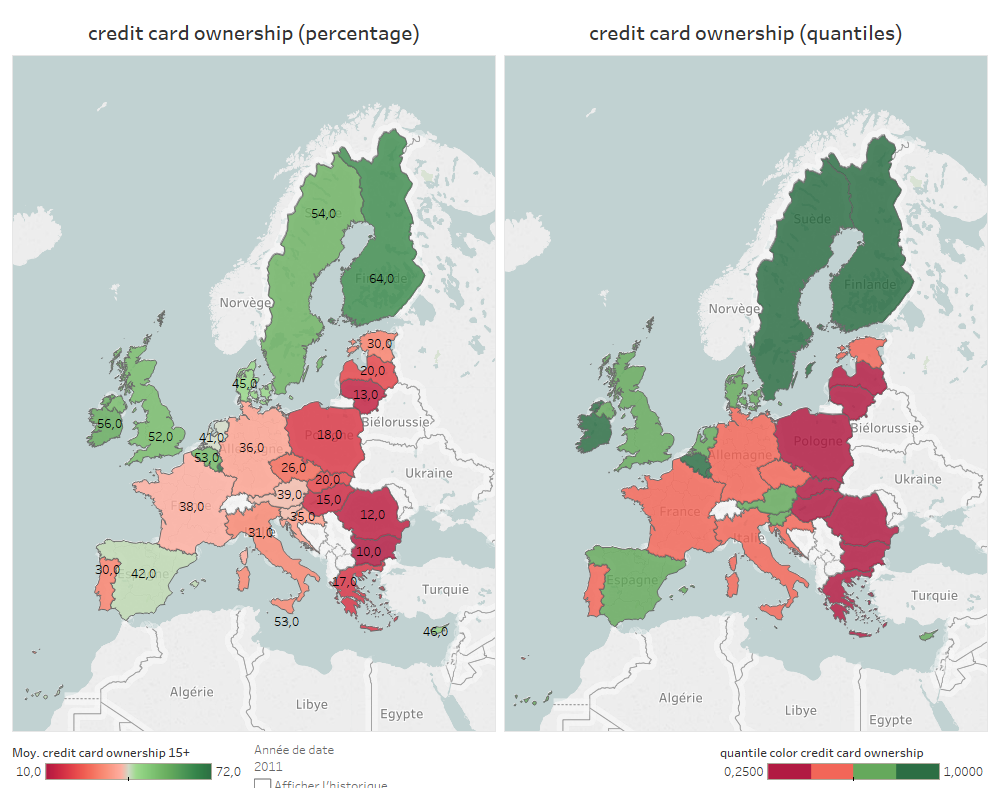
Credit card ownership in Europe in 2011
At the geographical level and quite unsurprisingly, credit card ownership is at its lowest level in eastern and southern countries.
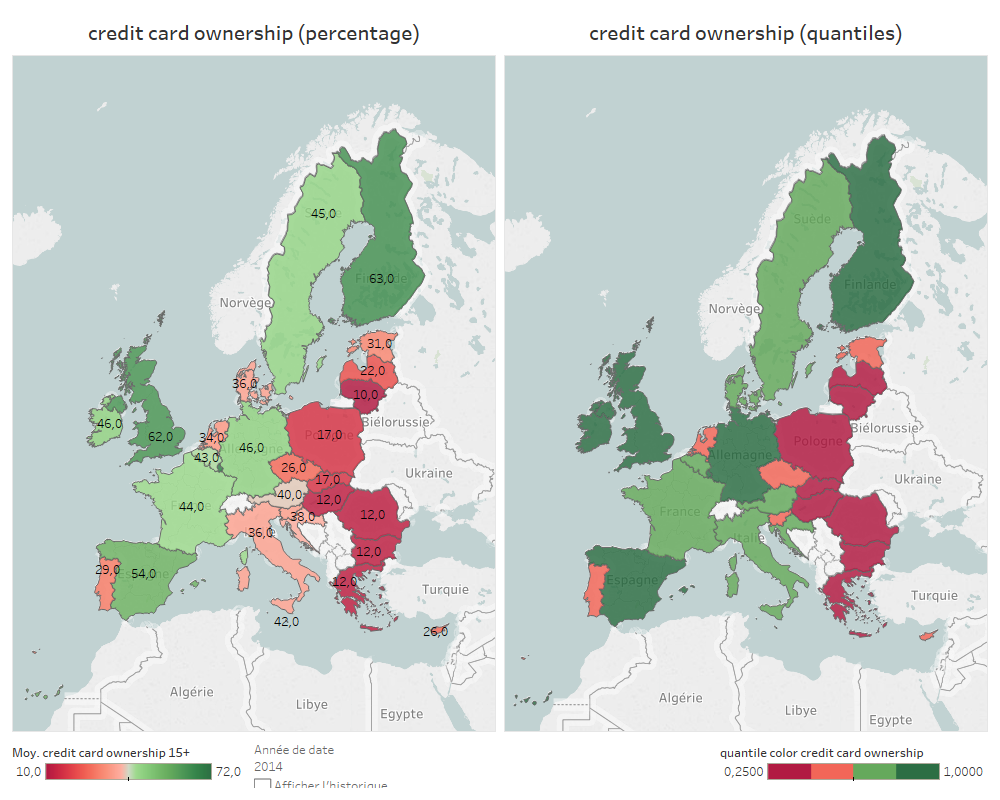
Credit card ownership in Europe in 2014
While things are changing after 2011 in terms of ownership, the situation of the southern and eastern countries remains low.
In this case, the quantile analysis doesn’t bring much value, unlike in the case developed by Ann and Josh Jackson on their blog.
This quick data visualisation enables nevertheless to put credit card payments stats back in perspective. In the case of Germany in particular what we should remember that 74% of payments were made in cash in 2017. How can we explain that Germans still prefer cash over cashless payments? What the data on credit card ownership shows is that it’s not because of lower-than-average credit card ownership. As you can see on the visualisation by quantile, Germany ranks actually pretty high compared to other European countries. It’s probably more of a cultural thing.
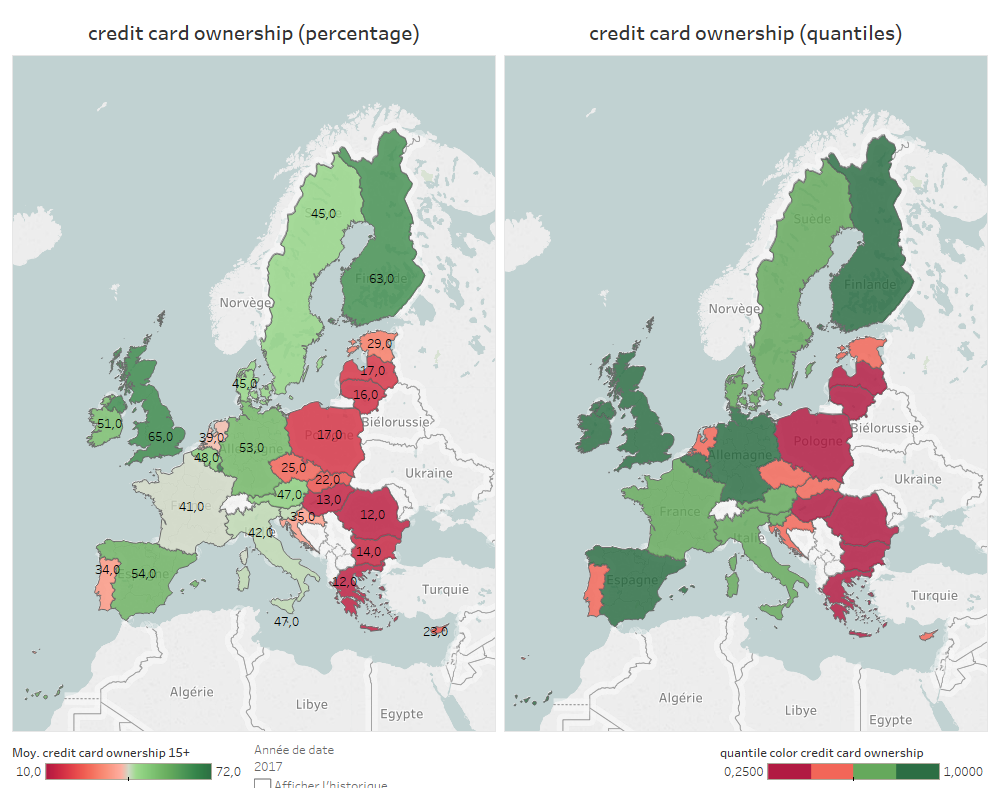
Credit card ownership in Europe in 2017
Advice for your market research (in Belgium, in France or anywhere)
What we have done above is to look for macro data, visualize it and interpret it. That kind of data represents societal trends (look for instance, at the evolution of credit card ownership between 2011 and 2017), which is a part of your PESTEL analysis. And since PESTEL is one of the first things you should do in your market research, the exercise above shows that you can rely on many different tools to study your market.
Rest assured, however, that you don’t need to use Tableau or any complex, similar data to display your data. You could achieve pretty much the same result using Excel (and a little bit of Visual Basic). But Tableau makes thing so much easier.
If you have any question on market research in general or PESTEL / visualizing data in Tableau in particular, feel free to get in touch. We are here to help.