
Carrying out a survey online is often confronted with the dropout rate problem. As early as the first response, 6% of respondents may drop out of your survey. Various research studies have shown that the normal dropout rate of an online survey exceeds 10% and can reach 20% in some cases. This article discusses the 4 factors that explain why a respondent drops out of an ongoing survey.
Contact the IntoTheMinds survey agency
The survey dropout rate: what you need to know
- The natural dropout rate for a survey is 10%, with an additional 2% per 100 items (Hoerger 2010). For most surveys, the natural dropout rate due to length is 11%.
- Some surveys have a dropout rate of up to 20%.
- An open-ended question multiplies the dropout rate of a survey by 2.5 (Peytchev, 2009)
Scientific research has shown that the dropout rate of an online survey is naturally higher than 10%. This problem substantially affects the people who use this technique to conduct market research. The average calculated on 185 surveys in Spain was 11.8%, and research conducted at the University of Michigan measured dropout rates of 13% to 17%.
There are 4 types of factors that predict the dropout rate of a survey:
- the design of your questionnaire (page and questions)
- Questionnaire design
- respondent factors
- peripheral data (“para data”)
The good news is that you can act on the first 2 factors.

Factor 1: Pages and questions of your survey
This factor refers to the design of your survey pages and questions.
Questions that require significant mental effort are the most likely to result in survey dropout.
Four types of questions are particularly targeted:
- Matrix questions
- open-ended questions
- very lengthy questions
- sensitive questions
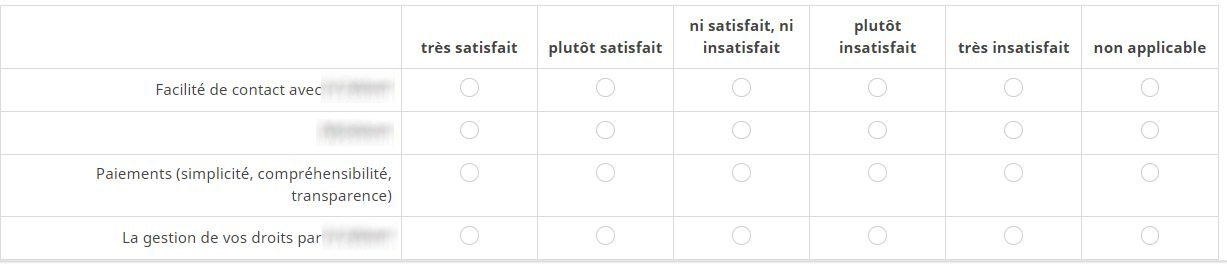
Matrix questions
Matrix questions are a classic in opinion surveys. They are very practical because they allow for condensing information and applying the same scale to several items. In theory, everything is fine. But in reality, these matrix questions can cause questionnaire dropout.
Open-ended questions
Open-ended questions are popular with survey sponsors. However, as a market research firm, we caution our customers about
- the quality of the answers obtained
- the effect of open-ended questions on participation rates
While the insights gained can enrich your understanding, it is important to remember that this question may put off respondents. Open-ended questions require respondents to explain their answers, which can be off-putting. The cognitive load imposed by this type of question sometimes acts as a deterrent for respondents who, frightened by the effort, prefer to drop out of the questionnaire. Peytchev (2009) has shown that an open-ended question in a survey increases the risk of dropout by 2.5.
If you insist on imposing this type of question, this leads to a small tip: place it at the end of the questionnaire. If the respondent is aware that it is the last question, they will probably be more inclined to make an effort to answer.
Very lengthy questions
By definition, human beings do not like effort. This is a fact and has a significant impact on surveys. When formulating your question, make sure you are as concise as possible.
Sensitive questions
So-called “sensitive” questions are a reason for dropout for a significant proportion of respondents. Tourangeau (2018) has researched this topic in-depth and provides multiple examples of the numerical effect of sensitive questions. For example, asking about a household’s annual revenue leads to a nonresponse rate of 8.15%. If this question is mandatory, the dropout rate will be the result of this question alone!

Factor 2: Survey design
We have already discussed the financial incentives that influence participation in a survey. The design of the survey itself is the second factor that influences questionnaire dropout. The other important aspect is the length of the questionnaire.
We cannot stress enough that imposing a lengthy questionnaire is a fundamental survey mistake. It is the mistake you should pay the most attention to. The topic has been researched by Hoerger (2010) and Peytchev (2009).
Hoerger calculated the natural dropout rate to be 10% with an additional 2% per 100 items. For most surveys, therefore, the natural dropout rate for a survey due to length is 11%.

Last element related to the length of the questionnaire: is the progress bar. It may be completely counter-intuitive, but the presence of a progress bar is a dropout factor. It makes the respondent aware of the effort they will have to make.
The second factor related to dropouts is the design of the survey. Examples are providing incentives independent of carrying out the survey (Silber, Lischewski, & Leibold, 2013), using a lengthy questionnaire (Hoerger, 2010), and displaying the progress bar alongside the questionnaire (Villar et al., 2013).

Factor 3: Respondent Characteristics
The third group of factors concerns respondents and their intrinsic characteristics. This also affects participation in quantitative surveys (see this article).
Although each research is unique, analyses show that, in general, male, non-white, student, and more affluent respondents are more likely to drop out of a survey. This is likely due to the poorer ability to handle the cognitive load of carrying out the survey. Peytchev (2009) and Blumenberg et al. (2018) showed that older respondents and those with little education were likelier to drop out of a survey.

Peripheral data
Para data is peripheral data collected during the administration of the survey. They are a sign that the respondent has dropped out of the survey:
- time spent on the first question
- the type of device used to answer (smartphone)
- change in response time between questions
- the proportion of questions left unanswered