Analyzing qualitative interviews is often problematic. In this article, we explain how to conduct a correlation matrix and give you practical advice on making the most of your results.

How do you analyze data from qualitative interviews? This is the question we answer in this article. We explain how to create a “correlation matrix” and which software to use.
Contact IntoTheMinds for your qualitative market research needs
Qualitative interview analysis in a nutshell
- Analyzing a qualitative interview requires a rigorous method. Unfortunately, most marketing departments are unfamiliar with the analytical approaches that must be applied.
- Coding interviewsis an essential prerequisite. It establishes an objective basis for the subsequent deployment of analytical tools. Coding is done manually using specialized software (Maxqda, Atlas. ti, or Nvivo).
- The correlation matrix is one such tool. It makes it easy to identify priority topics and how they relate.
- A correlation matrixenables us to move from a series of qualitative interviews to a pragmatic action plan.
We are often asked about qualitative methodologies in market research, specifically what to do with the data and how to analyze it.
Most qualitative analyses lack rigor
Qualitative interviews are an essential part of any exploratory approach to market research. However, qualitative interviews present challenges when it comes to analyzing the data. This is because the data is “unstructured,” i.e., mainly in the form of text.
As a market research agency, we observe that most customers need to learn to analyze interviews. This is due not only to a lack of technical knowledge but also to the practices of certain research institutes, which have imposed imperfect methodologies on the market.
Pricing pressure exerted by companies has slowly eliminated the most crucial stages of qualitative research. Essential analyses were withdrawn to propose more affordable solutions to the market. Focus groups slowly replaced qualitative interviews, even though these are 2 completely different approaches. Worse still, we observe that 99% of qualitative interviews are done without transcribing or coding. As a result, correlation matrices cannot be conducted, and recommendations are subjective. Of course, no one will tell you such things.
Coding, the basis of qualitative analysis
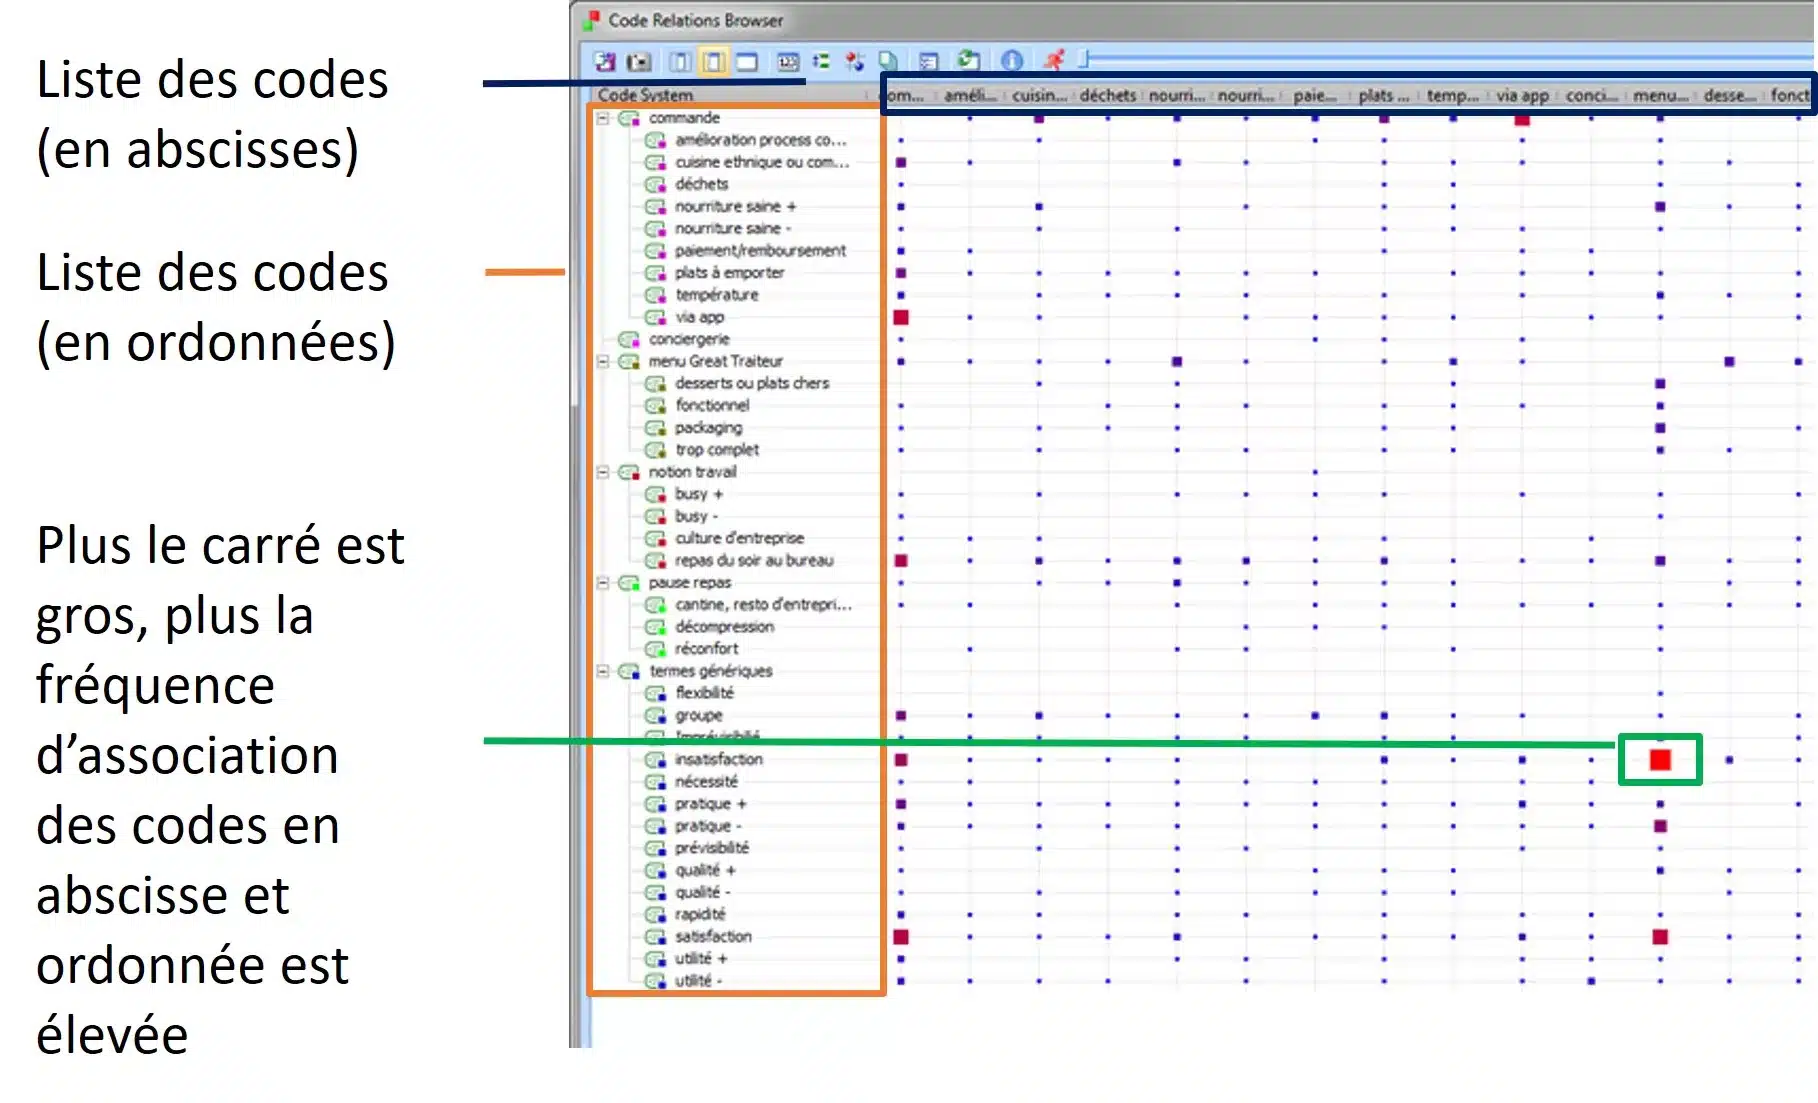
To establish a correlation matrix, you first need a coding guide, i.e., a list of codes for your interviews. These codes represent the different themes covered in your interviews.
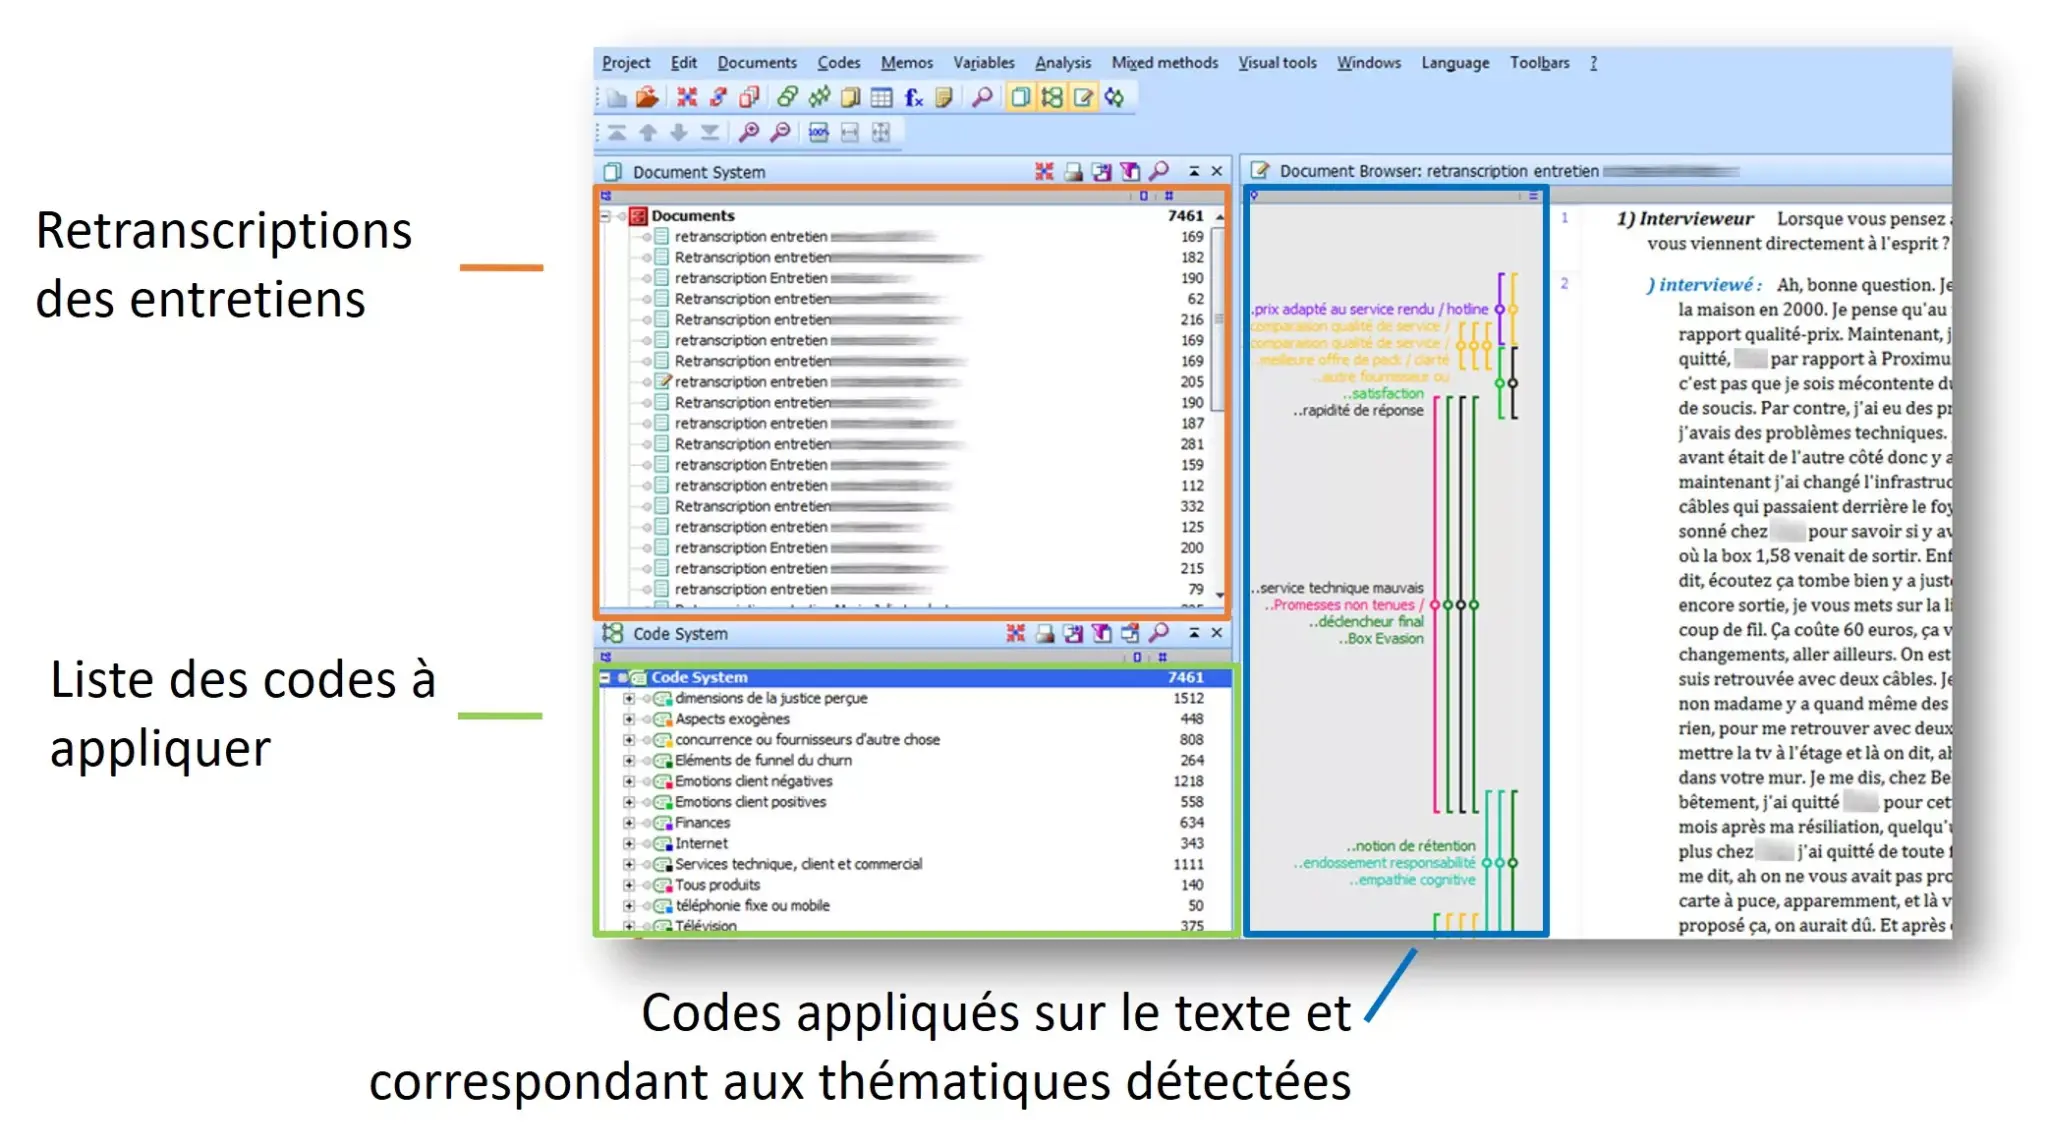
These codes must be applied to your text so that analyses can be conducted. The screenshot below shows the interface of Maxqda, a software program specialized in qualitative interview analysis. In the bottom left-hand corner is the code list, i.e., the list of different themes to be detected in the interviews. To simplify the analysis, the codes are arranged in folders according to the parent theme.
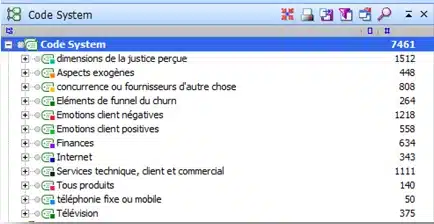
The number on the right corresponds to the number of codes applied for the theme in question. In the project illustrated in the screenshot above. This was a customer satisfaction research project for an Internet operator:
- 7461 text segments from the interviews were coded
- 1218 concerned negative customer emotions
- 558 positive emotions
Once these codes have been applied (manually), analysis software offers a range of tools for analyzing your data. The correlation matrix is just one of them. It is particularly powerful, and its advantage is that it presents results that are easy to understand and identify priorities in your marketing research.
The correlation matrix, a reliable way of analyzing qualitative interviews
A correlation matrix allows you to establish objectively:
- the hierarchy of themes discussed during interviews
- how the various themes relate to each other
The correlation matrix is based on the frequency of appearance of these codes and their correlations. In a correlation matrix, the most important thing is highlighting these correlations, which mark a link between two themes. These are known as co-occurrences.
The matrix will enable you to identify the nature of the associations and their “statistical” weight across all your interviews. The word “statistical” should be placed in quotation marks, as it is impossible to draw statistical conclusions from qualitative interviews. For statistical certainty, a survey is required.
Below is a typical example of such a correlation matrix (this example was produced using the excellent MAXQDA software).
What conclusions can be drawn from a correlation matrix?
A good correlation matrix will first give you an indication of the relative weight of each correlation. You can then classify the correlations and research each one. Here’s a concrete example from the satisfaction research we conducted for a telecom operator (see the first screenshot at the beginning of this article). We paid particular attention to both positive and negative emotions. The research included several dissatisfied customers who had switched operators (known as “churn”).
Using the correlation matrix, we highlighted the reasons for the most negative emotions. We ranked these reasons in descending order of importance, which enabled the operator to envisage solutions, particularly regarding interactions with call center agents. Here’s what we found.
What provokes the most negative emotions in customers?
- Lack of honesty (64)
- Wasted time (58)
- Quality of Internet connection (51)
- Hotline perceived as incompetent (37)
- Fee-based hotline (30)
What causes the most positive emotions in customers?
- Change of supplier (89)
- Comparison of quality of service/price/advantages (24)
- Quality of Internet connection (18)
- Fast, professional work (18)
The numbers behind each sub-topic represent the times the code was applied to that topic. For example, lack of honesty was coded 64 times as a negative emotion.
How do we present the results of a correlation matrix?
A “mindmap” is a straightforward way of presenting the results of a correlation matrix. It allows you to visually order the elements according to their priority and link them to a more global theme.
In the example below, we have visually represented the causes of negative and positive emotions in the context of a telecom operator.
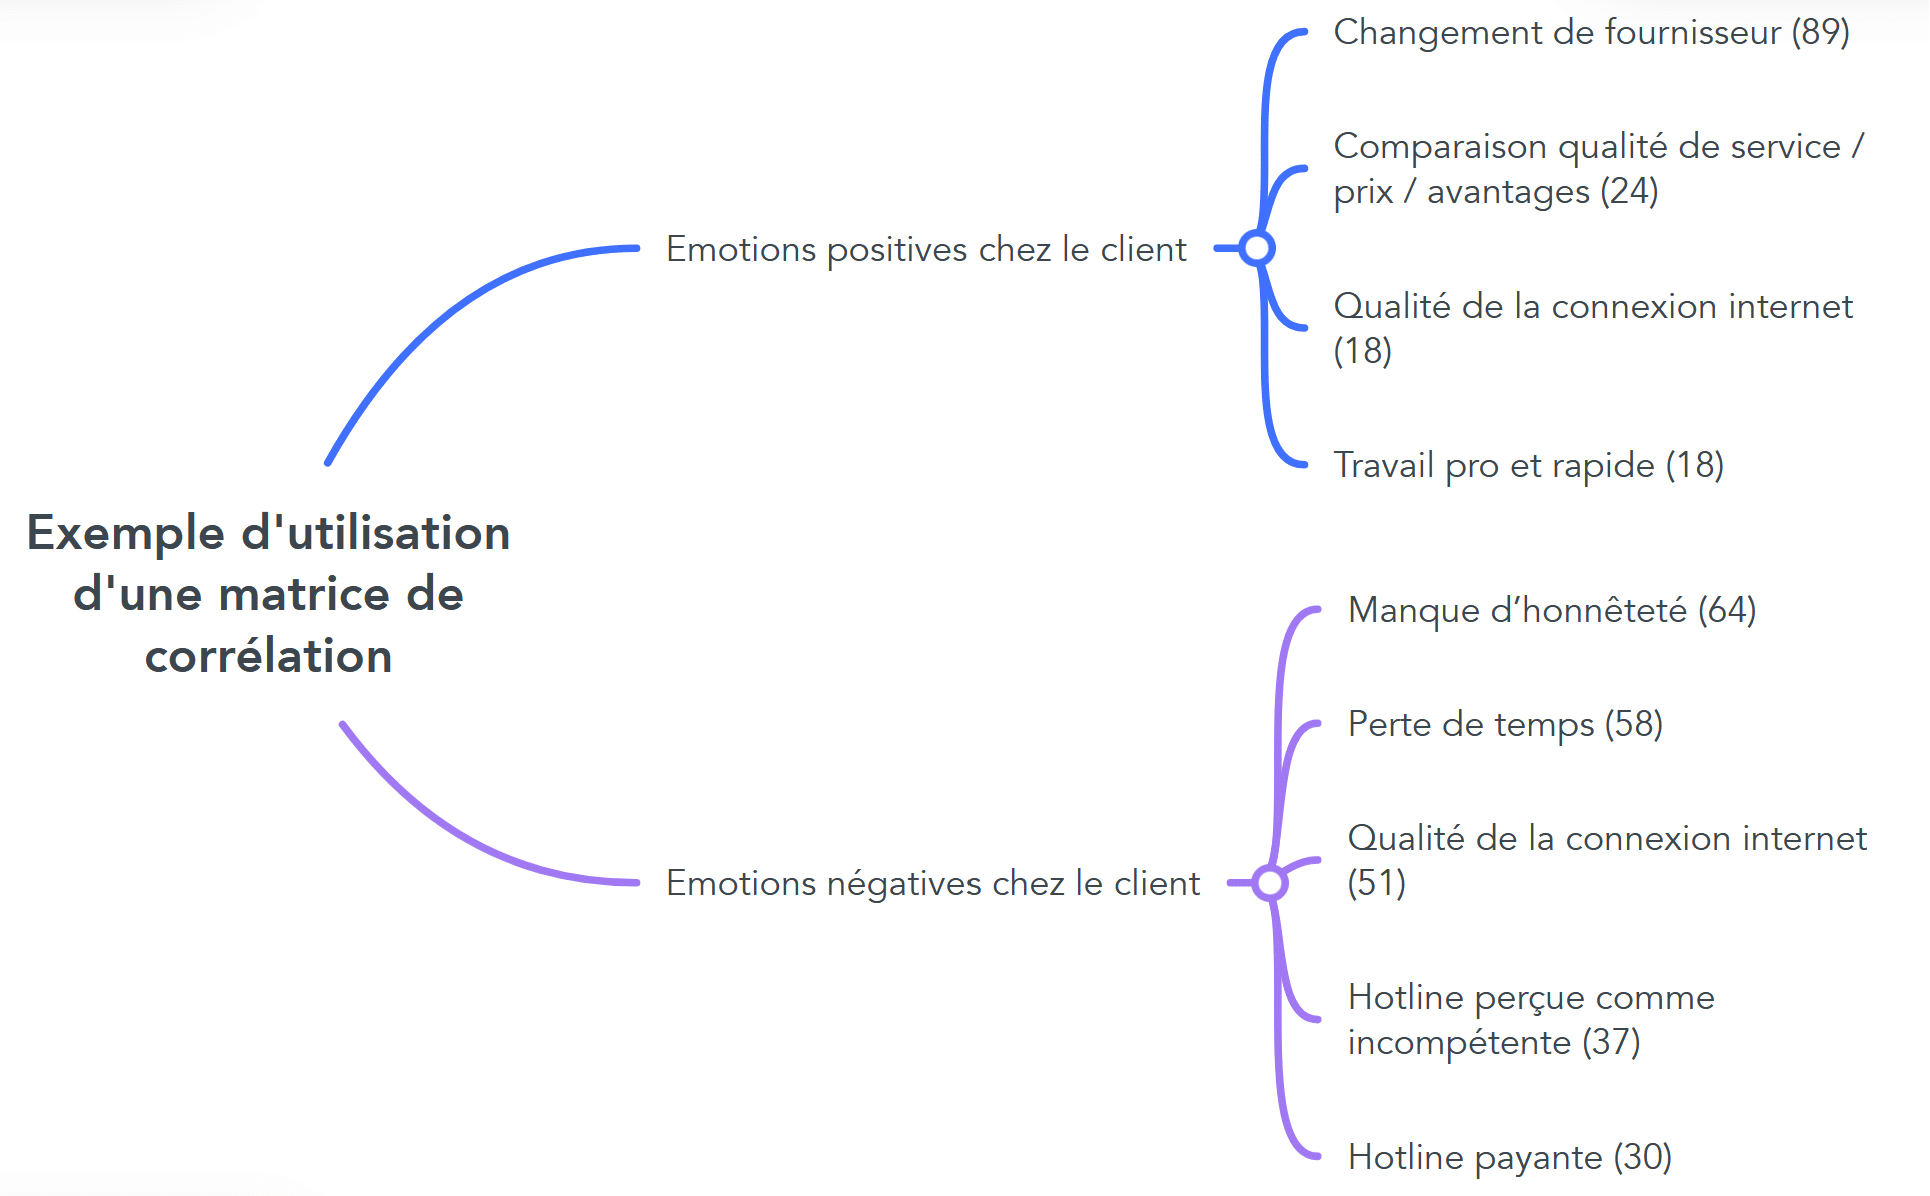
This “mindmap” brings you to the heart of your customers’ concerns. Each sub-topic (e.g., “lack of honesty”) can be the subject of an action plan. In this case, we’ll need to understand what words or behaviors are causing the customer to perceive a “lack of honesty” and how to remedy the situation.

Conclusion
The correlation matrix is an objective and rigorous tool for analyzing qualitative interviews. It is a time-consuming approach and requires appropriate software. Nevertheless, the advantages it offers are unrivaled. Hidden relationships between different topics can be uncovered, prioritized priorities and concrete action plans developed.