
As part of the Big Data Initiative (which I’m chairing) of the European Broadcasting Union, a conference was organized on 26 and 27 February 2019 in Munich to discuss the latest members’ projects in the field of data journalism.
Although more than a dozen presentations related to this topic twere given, I chose to report and compare in this article only 4 of them that are extremely concrete and launched each in a different country. Those projects had all on factor in common that contributed to their success : the local factor. I summed this golden rule into one motto : “Turn global data into local problems”.
In short, if you want your data journalism to be a succes, make sure that users get the local perspective of the data. That’s what interests them and will keep them on your website.
“Turn global data into local problems”.
Data journalism helps surfacing complex information : the case of Le Figaro
I invited Stéphane Saulier, the head of FigData which is the data journalism data of Le FIgaro. I’ve been a big fan of FigData and closely following their work for 12 months. They have regularly produced some amazing interactive tools allowing their readers to enjoy the exploitation of complex dataset.
The quite amazing KPI’s of FigData
In his presentation Stépane showed the milestones of Fig Data of the last months. One particular milestone was their work carried out for the 100th anniversary of world war I. Based on the inventory work of 1.4 million soldiers who have died for France, the Fig Data team was able to geolocalize where 80% of the soldiers had died, allowing their relatives to research their past and discover new facts about their family.
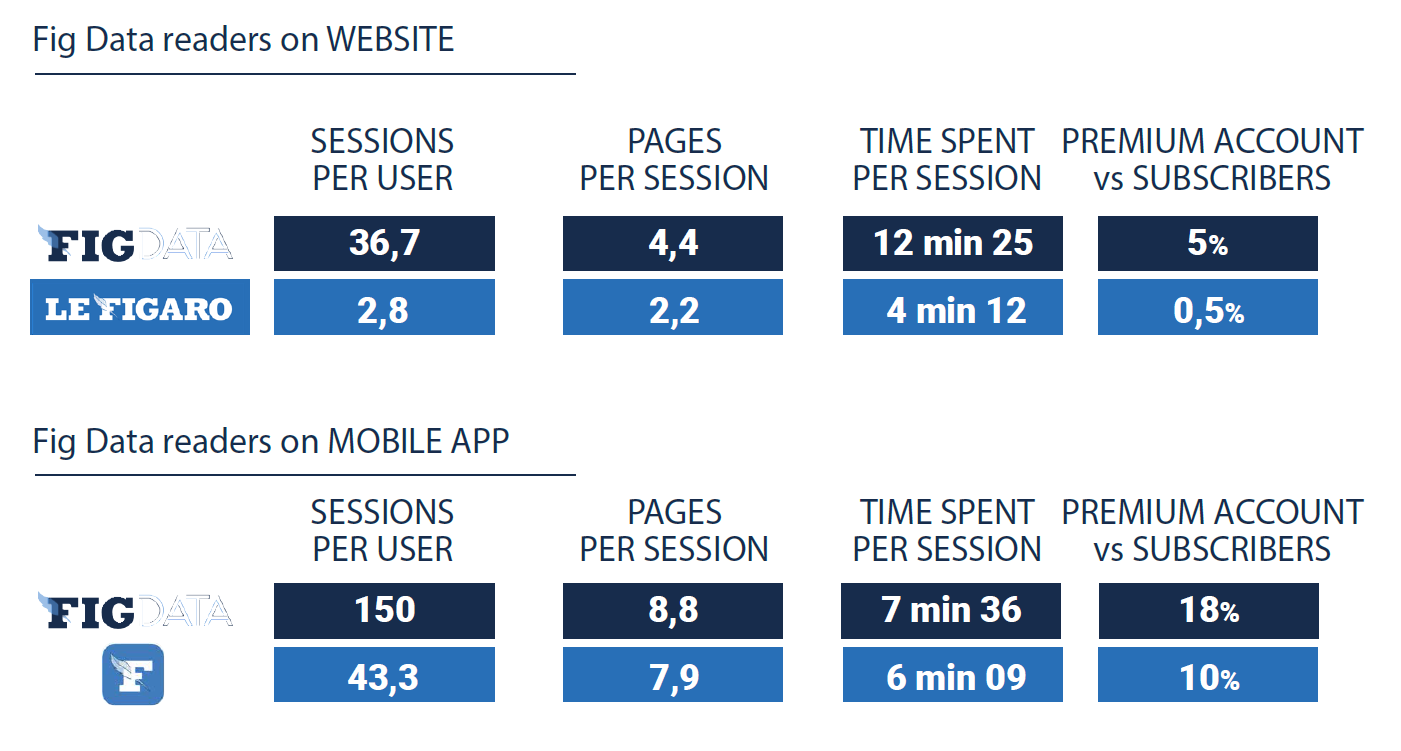
Finally Stéphane shared with us some statistics that clearly show there is an incentive in being data-driven. Data journalism projects do pay off when you carry them out well. The stats above speak for themsemves, don’t they?
Groundbreaking work at RAI : data on femicide in Italy
Presented by Sabino Metta, a researcher at the RAI R&D center in Turin (Italy), the femicide project proves that data can be used for surfacing complex issues and can contribute to the common good.
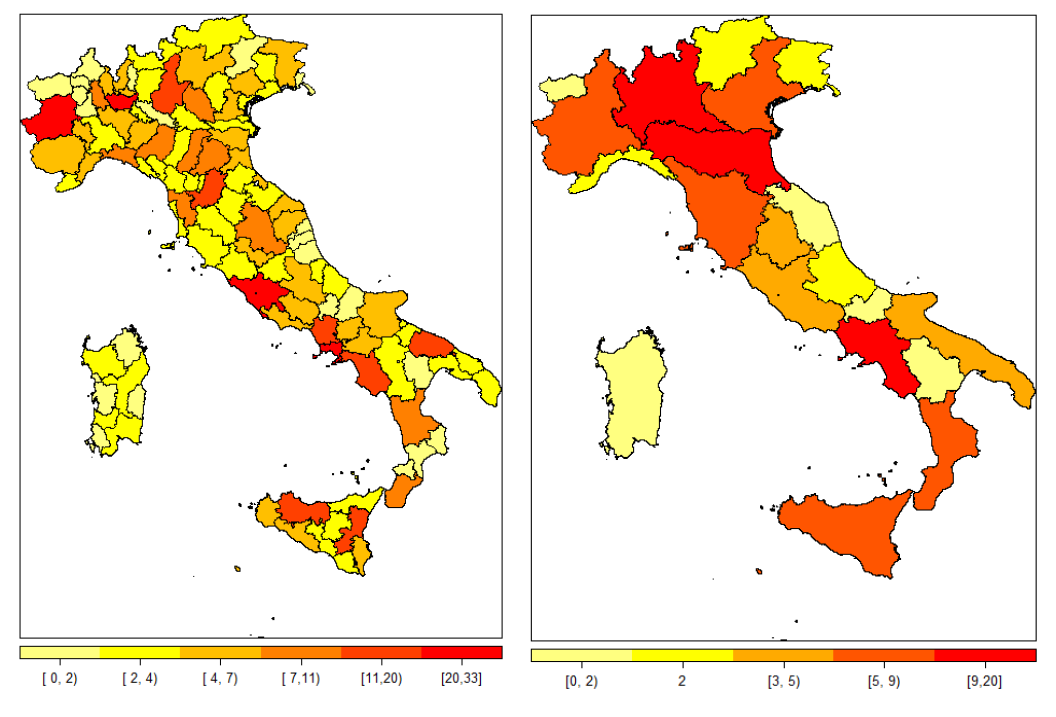
The aim of the project was to visualize violences to women in Italy. Sabino and his team developped complex methods to build a database of violence using Speech-to-text, semantic (NLP) analysis and segmentation techniques. This labour intensive work, based among others on RAI archives, allowed them to surface unique insights on where violence against women take place, the longitudinal evolution (over time) as well as unique statistics on for instance the correlations between aggressors and victims.
This is data journalism at its best and a major effort to make a major problem of our society visible.
Data journalism at ARD on global warming
How do you catch people’s attention on global warming? By making sure they understand what global warming will mean for them. A way to turn a data journalism project into a success is to focus on local issues. My key advice is “Turn global data into local problems”.
This is exactly what ARD, the German public broadcaster, did with its Klimadoppel project. Based on data provided by the Intergovernmental Panel on Climate Change, it makes it possible to predict what climate will look like in 2080. The interface built by ARD simulates future climate for 14000 cities in Germany and compares it to current climate on the planet. Two objectives are reached at once. On the first hand users get an accurate overview of the climate in their very city (local focus). On the other hand this overview is made concrete by comparing the climate with a city in a country that the user probably knows and can relate to.
Unsuprinsingly this interactive map attracted 2 millions users and was a total success.
Data journalism for the elections : the case of SVT
With 2019 European elections approaching, the data journalism project presented by Kristofer Sjoholm of SVT, th Swedish public television, was very much awaited. Kristofer presented various facets of the data projects around the latest elections in Sweden :
- the “Valkompass”, an application available for all citizens that allowed parties to specify the themes they will fight for for the local elections and collect reactions from voters. The broad coverage of the Valkompass in the press allowed this mobile app to be widely used and generate traffic.
- a “Build you own political majority” application which allowed users to get real-time feedback from SVT number 1 political expert on the different possible governmental majorities.