
The events of 2020 have accelerated the shift to telecommuting and digital relationships. With digitalization, another transformation is also underway: the analytics transformation. To face this data revolution, I find that businesses do not necessarily have the right tools for preparing and analyzing data (data preparation or data wrangling).
In this article, I wanted to put into perspective the role of these tools in the functioning of the business. In particular, I think they can contribute to efficiency gains, which I will try to demonstrate. In particular, I have defined 11 characteristics that determine the perfect data wrangling/data preparation solution. These are an extension of a draft I had already written on the subject.
Summary
- Data transformation: a challenge for human resources
- The 11 characteristics of an exemplary data wrangling/data preparation tool

Data transformation: a challenge for human resources
Historically, generating value from data was done by specialized and expensive profiles (doctors in data science, coders in R/Python). While outsourcing is always possible for specific needs, it has one major drawback: external consultants do not understand your business and need time to grasp the hidden subtleties of your data.
To take full advantage of your data and quickly extract all the knowledge and value from it, it is essential to internalize the data expertise and make available tools that the most significant number of people can use. The use of self-service data wrangling tools by all analysts seems essential to me. These are the people who understand the business problem to be solved and who are therefore the most likely to succeed if given the technical means.
Internalizing data expertise and making available tools that as many people can use as possible is essential.
This approach allows the analytical approach to get out of the straitjacket of the “Data Science” department. It is also the first step to instill a global analytics culture and be more “agile” (sorry for the buzzword).
There are many examples of people within businesses who already manipulate data. In 99% of the cases, everything is done with Excel, and this is where substantial efficiency gains can be realized using it. Indeed, good “data wrangling” / “data preparation” tools offer solutions to all the limitations of Excel (complex transformations, multiple data formats, volume, …). I prefer Anatella, which I’ve already talked about many times (for example, see here).
In the following paragraphs, I explain what I think the 11 characteristics of an ideal data preparation/data wrangling tool should be.

The data wrangling tool must be a “self-service” tool…
A self-service data preparation tool enables your analysts to solve business problems faster. They understand the data and its context, and with the right tool, they are autonomous in their resolution.

The preparation of the data must be rapid.
Typically, data scientists spend more than 85% of their time doing data preparation. A tool that increases the speed and productivity of data preparation is therefore welcome!
In particular, the most experienced data scientists have long realized that they need to reduce the time spent on “data wrangling” to do a better job. This is why, just like business analysts, the most experienced data scientists are asking for a “self-service” tool with a mouse, because it allows them to have an immense gain in productivity and time during the always costly “data wrangling” phase.

The chosen tool must be federative.
A tool that promotes and simplifies collaboration between business analysts (business-oriented) and data scientists (technical-oriented) seems to me to be essential. Without this unifying aspect, it is indeed difficult to achieve a global analytical culture within your business.
The federating aspect of a “data preparation” tool is perhaps the most difficult to achieve because the needs of business users are often far removed from the requirements of data scientists:
- Business analysts avoid code and want easy and immediate access to the desired information. They often work with small volumes of data and do not use highly complex algorithms.
- Data scientists like to code, and writing a thousand lines of code in R/Python is not going to stop them (after all, it’s only a day’s work!). They often work with larger volumes and use complex algorithms.

The possibility of iterative work
The work on data is endless and should be seen as a cycle. The cycle represented schematically below shows that the work is constant. It is constantly fed by new data: updated data on the one hand and data from new sources on the other.
Data processing is not an end in itself. It is a cycle, an eternal restart. The tools used must therefore be able to manage the update cycles.
Example of iterative data processing
Many businesses use Excel files to collect (and exchange) data from their employees. What happens when an employee decides to slightly modify the structure of an Excel file to fit the business problem at hand better?
This small change requires updating the data wrangling process that collects data from those duplicate Excel files. Suppose this data wrangling process is opaque (because it is programmed in an incomprehensible language that only insiders understand only on the day, they wrote the code). In that case, the whole data collection process is compromised. This leads to the production of invalid data and, ultimately, to wrong decisions. How many times have you heard a colleague tell you that this KPI is absurd and should be ignored? This (justified) lack of confidence in the analytical results is often due to data wrangling tools that are not transparent enough.

Adaptation to large volumes of data
I defend the idea of tools adapted to the fast processing of large volumes of data (see my benchmark here). The processing time is correlated to the volume of data to be processed. However, all too often, the tools available to business analysts are too slow or do not allow them to manage large volumes of data.

A powerful tool independent of resources in the cloud
The question of computing power in data preparation is, in my opinion, central. To give analysts autonomy, they must answer all their questions without depending on access (or not) to a cluster of machines in the cloud. If the available computing power constrains you in your analyses, you will get frustrated.
Although it is now elementary to create clusters of machines in the cloud, the price is still high. Because of this high price, a “normal” company will limit itself to making one cloud cluster (or even two). The use of this cluster will also be reserved for a small number of data scientists.
It is easy to understand that, under these conditions, the development of a global analytical culture is compromised. If only two people have access to the cluster, how can you increase efficiency and avoid creating bottlenecks?
In addition to the prohibitive price of the cloud, there is also the issue of data sovereignty when data is stored on a US cloud. For more on this topic: see the ‘Schrems II’ decision in case C-311/18 here.

A tool with fixed costs
I’m pretty allergic to the idea of not knowing in advance what the data analysis is going to cost me. Yet, that’s the situation all businesses that use AWS or Azure for data processing find themselves in. The variability of costs makes it impossible to anticipate what the next bill will be. In other words, there is a variable cost associated with each analytical question.
An inherent property of cloud clusters is the “variable cost” associated with each analytical question. This is perhaps the “Key Selling Point” of the cloud giants’ offerings: “You only pay for what you use.”
A motivated data scientist will thus be the source of higher variable costs because he will make intensive use of the cloud cluster to understand the data as well as possible. On the contrary, a less motivated data scientist will cause lower variable costs.
The monitoring of processing costs in the cloud sanctions the most active and motivated data scientists.
If the assessment of data scientists is based on the costs they generate, we end up in a paradoxical situation. Those who work the most and are the most motivated are penalized. The “parsimonious” use of the cluster thus becomes the norm. As this situation happens all the time, there are now many tools specialized in “cloud monitoring” that allow sanctioning and cutting off access to computing resources to all data scientists who are a little bit motivated. Under these conditions, it is easy to understand that keeping data scientists motivated is likely to be complicated.
To finish on this subject, a data wrangling tool that works on “variable costs” (like 99% of cloud solutions) has the effect of penalizing, discouraging, and finally preventing your best people from working.

Simplifying industrialization
A good data wrangling tool should allow you to easily industrialize and automate the “recipes” developed by your teams.
Here are some specific features that appear essential to me:
- easy integration with any scheduling program (e.g., MS-Windows task scheduler or Jenkins).
- quick implementation within your current IT infrastructure or other languages or other data frameworks. For example, calling a data wrangling procedure from a small Python script is a must.
- robust enough to handle a sudden increase in data volume without crashing.

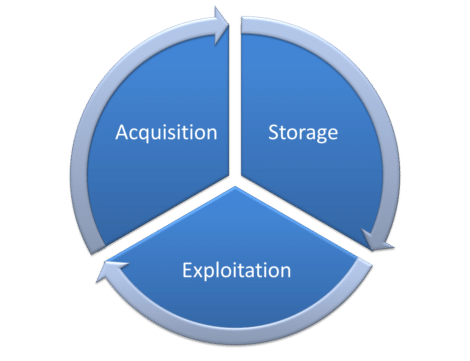
Integrated tool
Some ETL solutions are not ETL because the “transformation” part (the “T”) is absent or insufficiently developed. I give priority to tools that cover all 3 parts of the data cycle: acquisition, storage, exploitation. It must be possible to move from one to the other without difficulty and any accidental loss of information.

Multiplicity of connectors
I have already talked many times about the importance of having as many connectors as possible. Today, data comes from everywhere, in more and more formats, and sometimes proprietary.

Numerous data transformation features
This is a point that I have already mentioned many times, and that seems to me essential in a “No Code” approach. You need to have a maximum number of pre-programmed “boxes” to cover the everyday data transformation operations.
Of course, all ETL solutions worthy of the name have a wide range of “boxes” available. But some have more than others (e.g., Anatella), which can be very handy.
This last point seems obvious, but, surprisingly enough, there are, in the end, very few software solutions that meet this need. Indeed, many software vendors are content to provide broad connectivity and completely forget about the “data transformation” aspect, which is at least as necessary a component, if not more so. Would you like some examples? Here are two.
Fuzzy matching
Extremely useful to reconcile 2 databases when the quality is not excellent. Yet, I know only one solution that proposes it natively (see here for more info).
The pivotal function
If you are doing data visualization, being able to rotate your data is the basis. However, here again, 99% of data wrangling solutions do not propose it (in Anatella, the boxes are called “flatten” and “unflatten”)


![Illustration of our post "Free Generative AI Detectors: Which Ones to Choose? [Complete Test 2025]"](/blog/app/uploads/sherlock-holmes-120x90.webp)