
The first day of the RecSys 2018 conference was dedicated to tutorials. One of them was assigned to mixed methods for evaluating user satisfaction. It was organised by a team of Spotify researchers (Jean Garcia-Gathright, Christine Hosey, Brian St. Thomas, Ben Carterette) and Fernando Diaz of Microsoft Research (Canada). The tutorials covered aspects of qualitative research, quantitative research and analysing data; a combination of techniques that very much resembles market research.
Contact us for our B2B studies
Recommender systems are evaluated using system-oriented metrics.
This is the very starting point of this tutorial. Most metrics used to evaluate recommendation algorithms are system-oriented: the algorithms mainly measure errors. An excellent overview provided by Marco Creatura after RecSys 2017 shows which metrics were used:
- MSE: mean square errors
- F1 score
- MAE: mean average error
- RMSE: root mean square error
- MAP: mean average precision
- Precision and Recall: Recall is the fraction of positive examples that are correctly labelled (Recall = TP/(TP+FN)); Precision is the fraction of samples classified as positive that are genuinely positive (Precision = TP/(TP+FP))
- nDCG: discounted cumulative gain
- AUC: (area under the curve)
- MRR: Mean reciprocal rank
See this article for an overview of ROC and Precision-Recall.
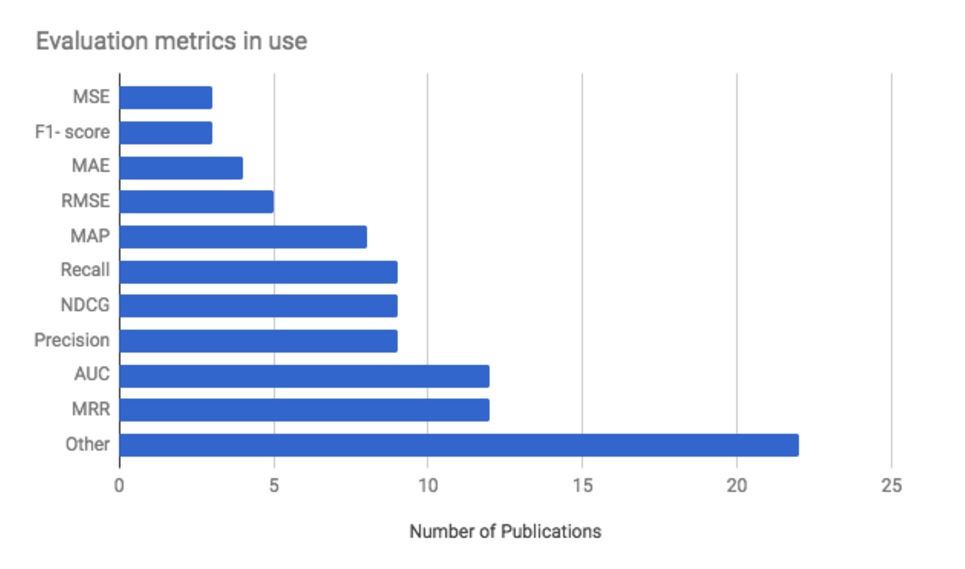
The analysis by Marco Creatura on the metrics used to evaluate the recommender systems presented during the RecSys2017 conference
Measuring satisfaction requires a combination of techniques.
Next to system-oriented metrics, user studies are also being used (more rarely though). Yet the first is even more seldom combined with the second.
The benefits of combining both techniques (user studies and system metrics) were the very focus of this tutorial, and my guess is that it opened the eyes of many of the attendees (including me). Despite my specialisation on customer satisfaction, I must admit that working on a daily basis on recommendation algorithms tends to make you lose the perspective on what really matters: satisfaction!
“models of satisfaction based on observed user behaviour are only as good as the logging mechanism.”
Focus on satisfaction: first qualitative then quantitative research.
The organisers outlined the process of mixed research methods. It first starts with qualitative research techniques to understand behavioural drivers and propose an overarching behavioural model. Quantitative techniques (surveys, on the one hand, logged data on users’ behaviours on the other hand) then allow to verify the model and quantify behaviours.
We’ll not go in details about the qualitative part (we have a comprehensive white paper on market research techniques that has an extensive section on qualitative research) and will instead focus on logging online behaviours.
Interpreting algorithms performance: which behaviours should you log?
The question of which metrics to log to measure algorithms performance is so important, yet often neglected. Most metrics (include those above) are based on clicks. This is however very insufficient to approach a complex construct like user satisfaction.
The organisers of the workshop proposed a useful framework to better approach user satisfaction with recommender systems. It Is divided into 4 categories:
- attention
- interaction
- task success
- retention
They did an excellent job of going back to the very definitions of those metrics which was useful to put logged data back in perspective. For instance, how useful can be a recommendation if the user doesn’t see it (“attention”) and what does the user want to achieve when he/she consumers a proposal?
Those research questions are instrumental and are often entirely overlooked.
Common user behaviours and how to log them
Going now in detail about online behaviours, we use the above framework to discuss variables that you should track.
Attention
The main question that we are trying to answer with this data is whether the user saw the system decision, in other words, whether or not the user saw the algorithmic recommendation. Not seeing it leads to inaction, a behaviour we have dealt with in another article.
Measuring attention, which is a concept broader than just “having seen” requires that you log and analyse:
- Page load: long page loading time can lead recommendations to not being visible
- Page scroll: does the user scrolled down to the recommendations and does the scrolling time enabled you to infer whether he had the time actually to see the recommendations?
- Cursor tracking: tracking the cursor can help you understand whether the user saw the recommendations. There are indeed studies of how eyes movements follow cursor movement which helps infer whether a suggestion came in the user’s field of vision.
- Touch gesture for mobile devices: zooming in on a recommendation is a visible proxy for attention.
- eye-tracking: finally, eye-tracking is the ideal method for tracking users’ attention. It informs you both on the eye’s movements (the trajectory of the eyes while browsing a page) and the time spent on the various elements.
Interaction with recommendations
Interacting with the recommendations is obviously very important, and it encompasses a series of micro-behaviours you need to track.
Here are some of the most common online interaction behaviours.
- Click
- Consumption time: as obvious as it may seem, consumption time is interpreted differently depending on the platform. Consuming more than 3 seconds of a video on Facebook is considered a view. On YouTube, this is 30 seconds. The threshold is critical and will have maximal impact on how you analyse your data.
- Saving an item into a playlist, into a repository is also a strong signal of how much you like the recommendation.
- Sharing an item on social media can be considered word-of-mouth and is a strong signal that you feel something about the recommended item. Be careful. It doesn’t mean necessarily that you liked it. It can also say you dislike it so much that you want the entire world to know.
- Comments are a strong indication that something happened with the recommendation (can be positive or negative)
- Alike or, even better, emotion-related explicit feedback is beneficial to understand better how the user interacts with your interface. Facebook’s emoticons are an excellent example of how to distinguish the different feelings a user may have when interacting with your content.
- Re-consumption of an item is a powerful signal that something happened. Like in the case of “sharing” it’s not necessarily linked to your liking of the item. You can hate it so much that you want to re-consume it but the likelihood is quite low. Re-consummation usually stresses a strong preference.
- Knowledge: this is a fascinating behaviour that we often forget to track. In the Spotify interface, for instance, you can click on the artist’s name to get more information about her.
Task success:
The main question you try to answer here is “Was the user satisfied with the recommendation?”
Inferring task success requires that you understand very deeply what the user wants to achieve. Success is measured by a user’s goal. If you deliver a recommendation or a series of recommendations (a playlist for instance), a complete consumption is a good signal that the user was satisfied with the proposal.The workshop’s organisers pointed to a very interesting by Mehrotra et al. (2017). This paper shows that the context determines how specific signals need to be interpreted.
“A request is no more than a guess about the attributes the desired document is expected to have”
Retention / Loyalty
If algorithmic recommendations are perceived as useful by the user, you may expect her to become loyal, to come back and to consume more. As a consequence of satisfying proposals, the user may:
- come back more often
- consume more
- change his/her behaviour (for instance search for new things)
- explore more and ‘venture” into categories he didn’t use to browse before
In short, retention / loyalty can take many shapes. It’s not just about page views per visit. It’s also about other metrics you carefully need to choose based on the context and on your understanding of what the user wants to achieve through this particular interface.
Conclusions
In conclusion, I found this workshop extremely valuable. It helped me reflect on how I use to collect and analyse data. I realise there is a need to come back to the basics and to really try hard to understand what customer satisfaction means. Ironically, an as a customer satisfaction expert, I can’t explain myself how I lost sight how the importance of qualitative research and how building behavioural model in an algorithmic recommendation setting. That’s probably the sign that when you do something for too long a time, you tend to be less critical of your own actions.
Reference: R. Mehrotra, A. Hassan Awadallah, M. Shokouhi, E. Yilmaz, I. Zitouni, A. El Kholy, M. Khabsa. Deep sequential models for task satisfaction prediction. CIKM 2017


![Illustration of our post "Digitization: food & beverage industry companies lag far behind [Research]"](/blog/app/uploads/marche-alimentation-bio-long-120x90.jpg)
![Illustration of our post "Generation Z and work: employers’ perceptions [Research]"](/blog/app/uploads/generation_y_youngsters-120x90.jpg)