
![LinkedIn: engagement statistics by country and language [2021]](/blog/app/uploads/likes-comments-share.jpg)
How does engagement on LinkedIn vary by language and country? Globally, 71.06% of LinkedIn posts receive no comments, and 24.39% receive no likes. The analysis of 4.599 million LinkedIn posts gives us an objective view of the essential differences that exist.
The data comes from a dataset made available by Linkalyze. The data preparation was realized using Anatella (Timi) and the visualization using Tableau.
If you are interested in these results, do not hesitate to subscribe to my newsletter, on which I publish other unpublished statistics. To subscribe, enter your email address below. Don’t forget to confirm the link sent to you by email; otherwise, I won’t be able to send you my latest results.
Some statistics on comments and Likes on LinkedIn
- 71.06% of LinkedIn posts receive no comments
- 24.39% of LinkedIn posts do not receive any likes
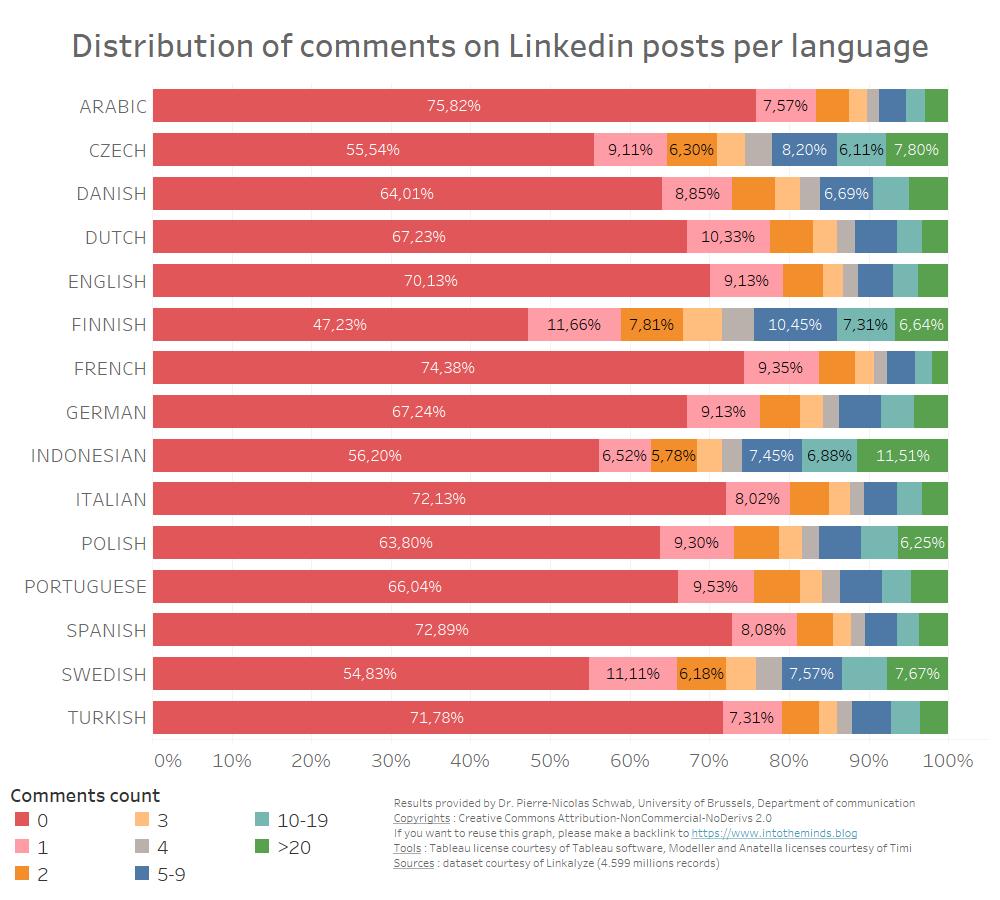
- 47.23% of the posts in Finnish do not receive any comment against 75.82% in Arabic
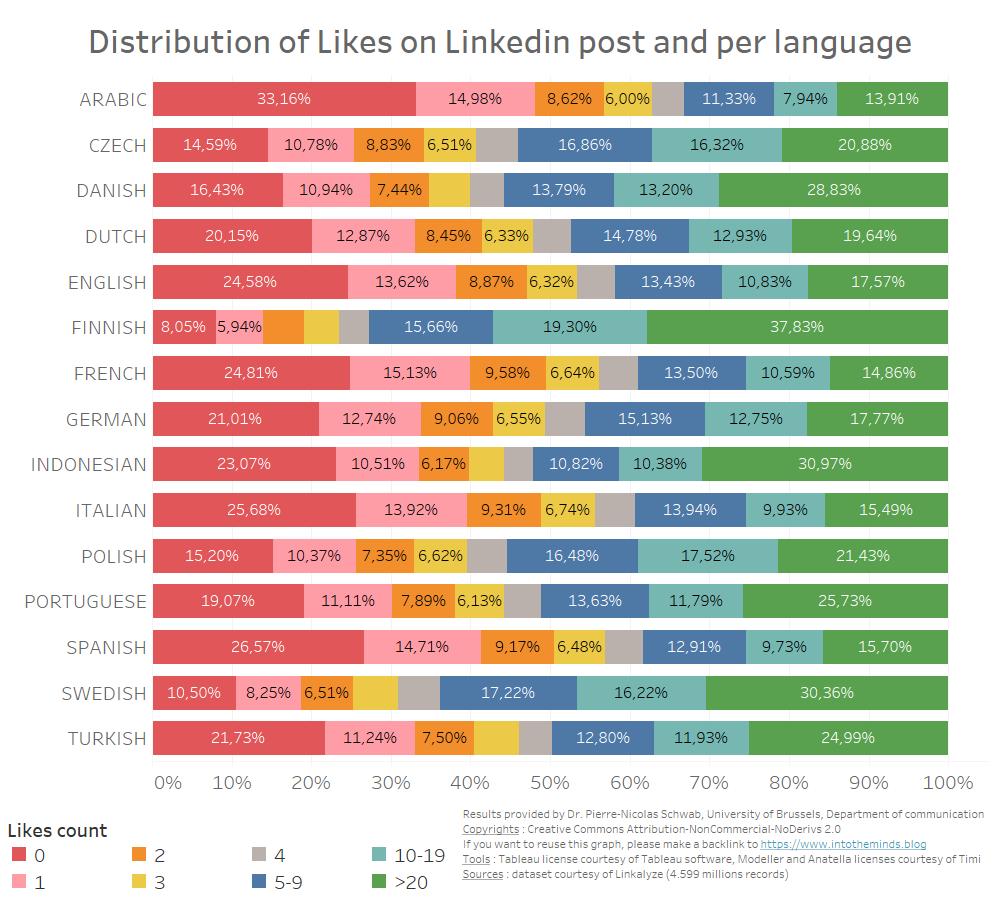
- In English, 24.58% of LinkedIn posts receive no likes, and 17.57% receive 20 or more likes.
- Only 14.86% of French posts receive 20 or more likes on LinkedIn
- The language that gets the least likes/comments is French: 2.1 comments and 17.8 likes on average
- There are 4x more posts in Arabic that receive no likes than posts in Finnish.
- In the US, a LinkedIn post receives an average of 29 likes and 4.1 comments
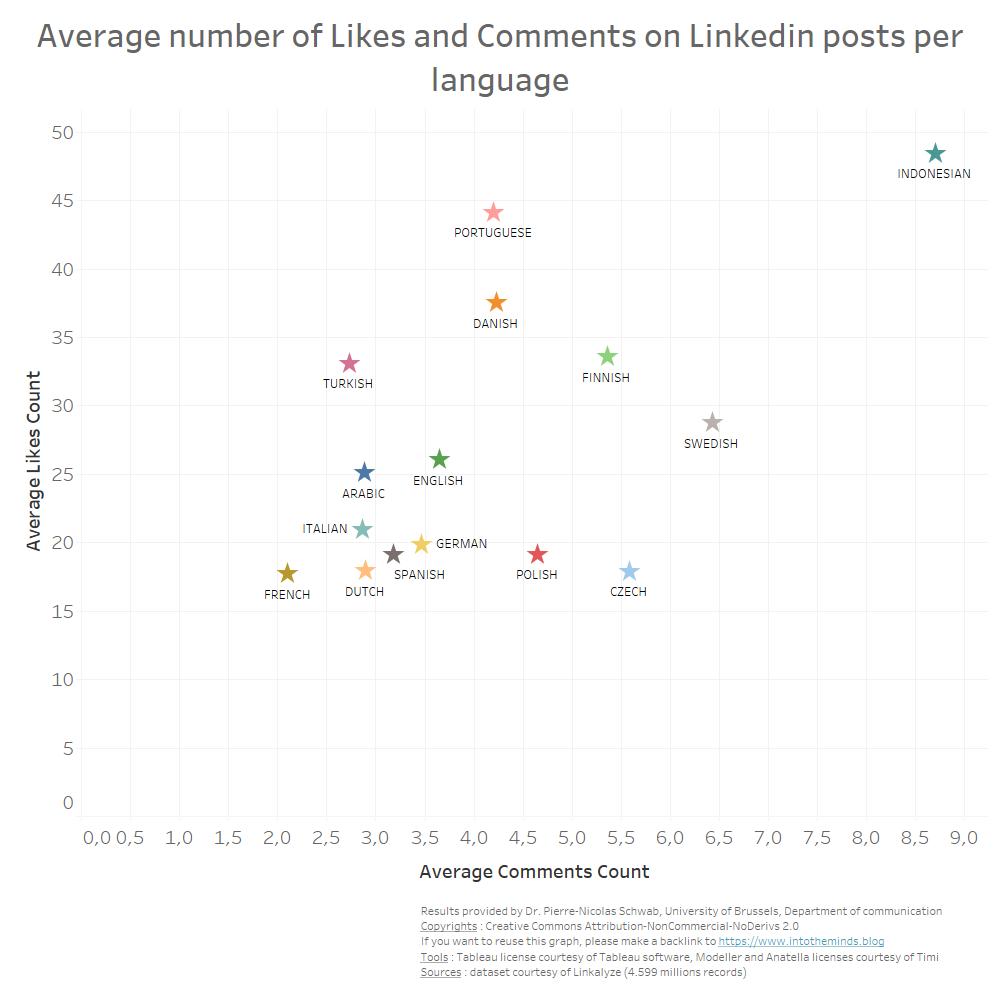
What is the average number of likes and comments per LinkedIn post?
The average number of Likes and comments varies greatly depending on the language. In our dataset, we have found LinkedIn posts in 15 languages. The figure below shows the results. Czech was the least represented language with 6256 posts, and English the most represented with 2.556.617 posts.
We can see that French is the language for which LinkedIn posts get the least amount of likes on average: 2.1 comments and 17.8 likes. Indonesian is at the other end of the spectrum, with 8.7 comments and 48.5 likes.
Distribution by language of the number of comments on LinkedIn
The analysis of the distribution of comments by language offers a different reading of the phenomenon. Whatever the language, the majority of LinkedIn posts do not get any comments. But this reality differs according to the language, as you can see on the graph below (in red, the proportion of LinkedIn posts that receive no comments; in green, the one that receives more than 20).
Differences of 30 points can be observed between Finnish, Czech, and Swedish on one side and French, English, or Spanish.
Distribution by language of the number of Likes on LinkedIn
The disparities by language are also observable for Likes. The difference is particularly noticeable between Arabic and Finnish.
In English, French, and Spanish, almost 1/4 of the posts do not get any likes, a ratio that is only exceeded by posts in Arabic (33.16%).
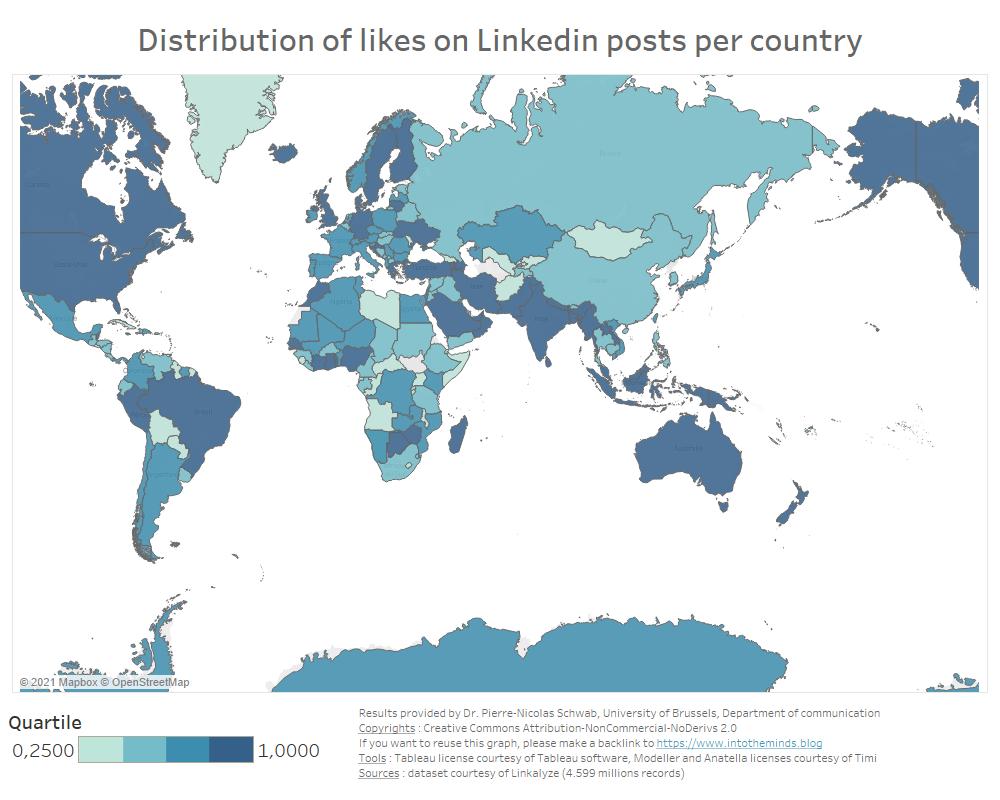
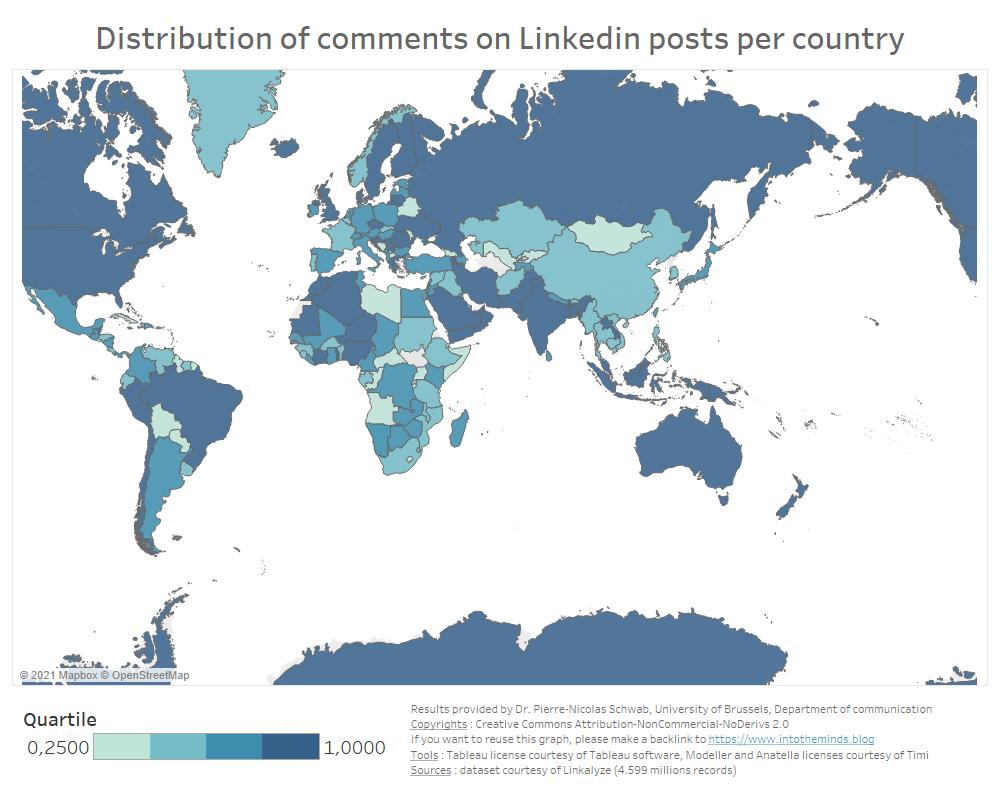
In which countries do we get the most likes on LinkedIn?
Not all countries are equal in terms of likes on LinkedIn. Here is what I discovered when analyzing the results for the 193 countries in the dataset.
To abstract the extreme data in some micro territories, I chose to represent the data as quartiles. In other words, the data were normalized and then assigned to a segment based on their value.
This visualization by quartile is handy when some extreme values (outliers) “erase” the differences that may exist. For a complete discussion on the subject, I refer you to this article.
This map allows us to visualize to which quartile each country belongs. Thus, becoming aware of the differences between territories in terms of likes.
In which countries are LinkedIn posts most commented on?
We repeated the same analysis with the average number of comments on LinkedIn, and as you can see, differences appear between the two maps. With 3.3 comments on average on each LinkedIn post, Russia is, for example, in the top quartile while it is in the 2nd quartile for likes (10 likes on average per post).
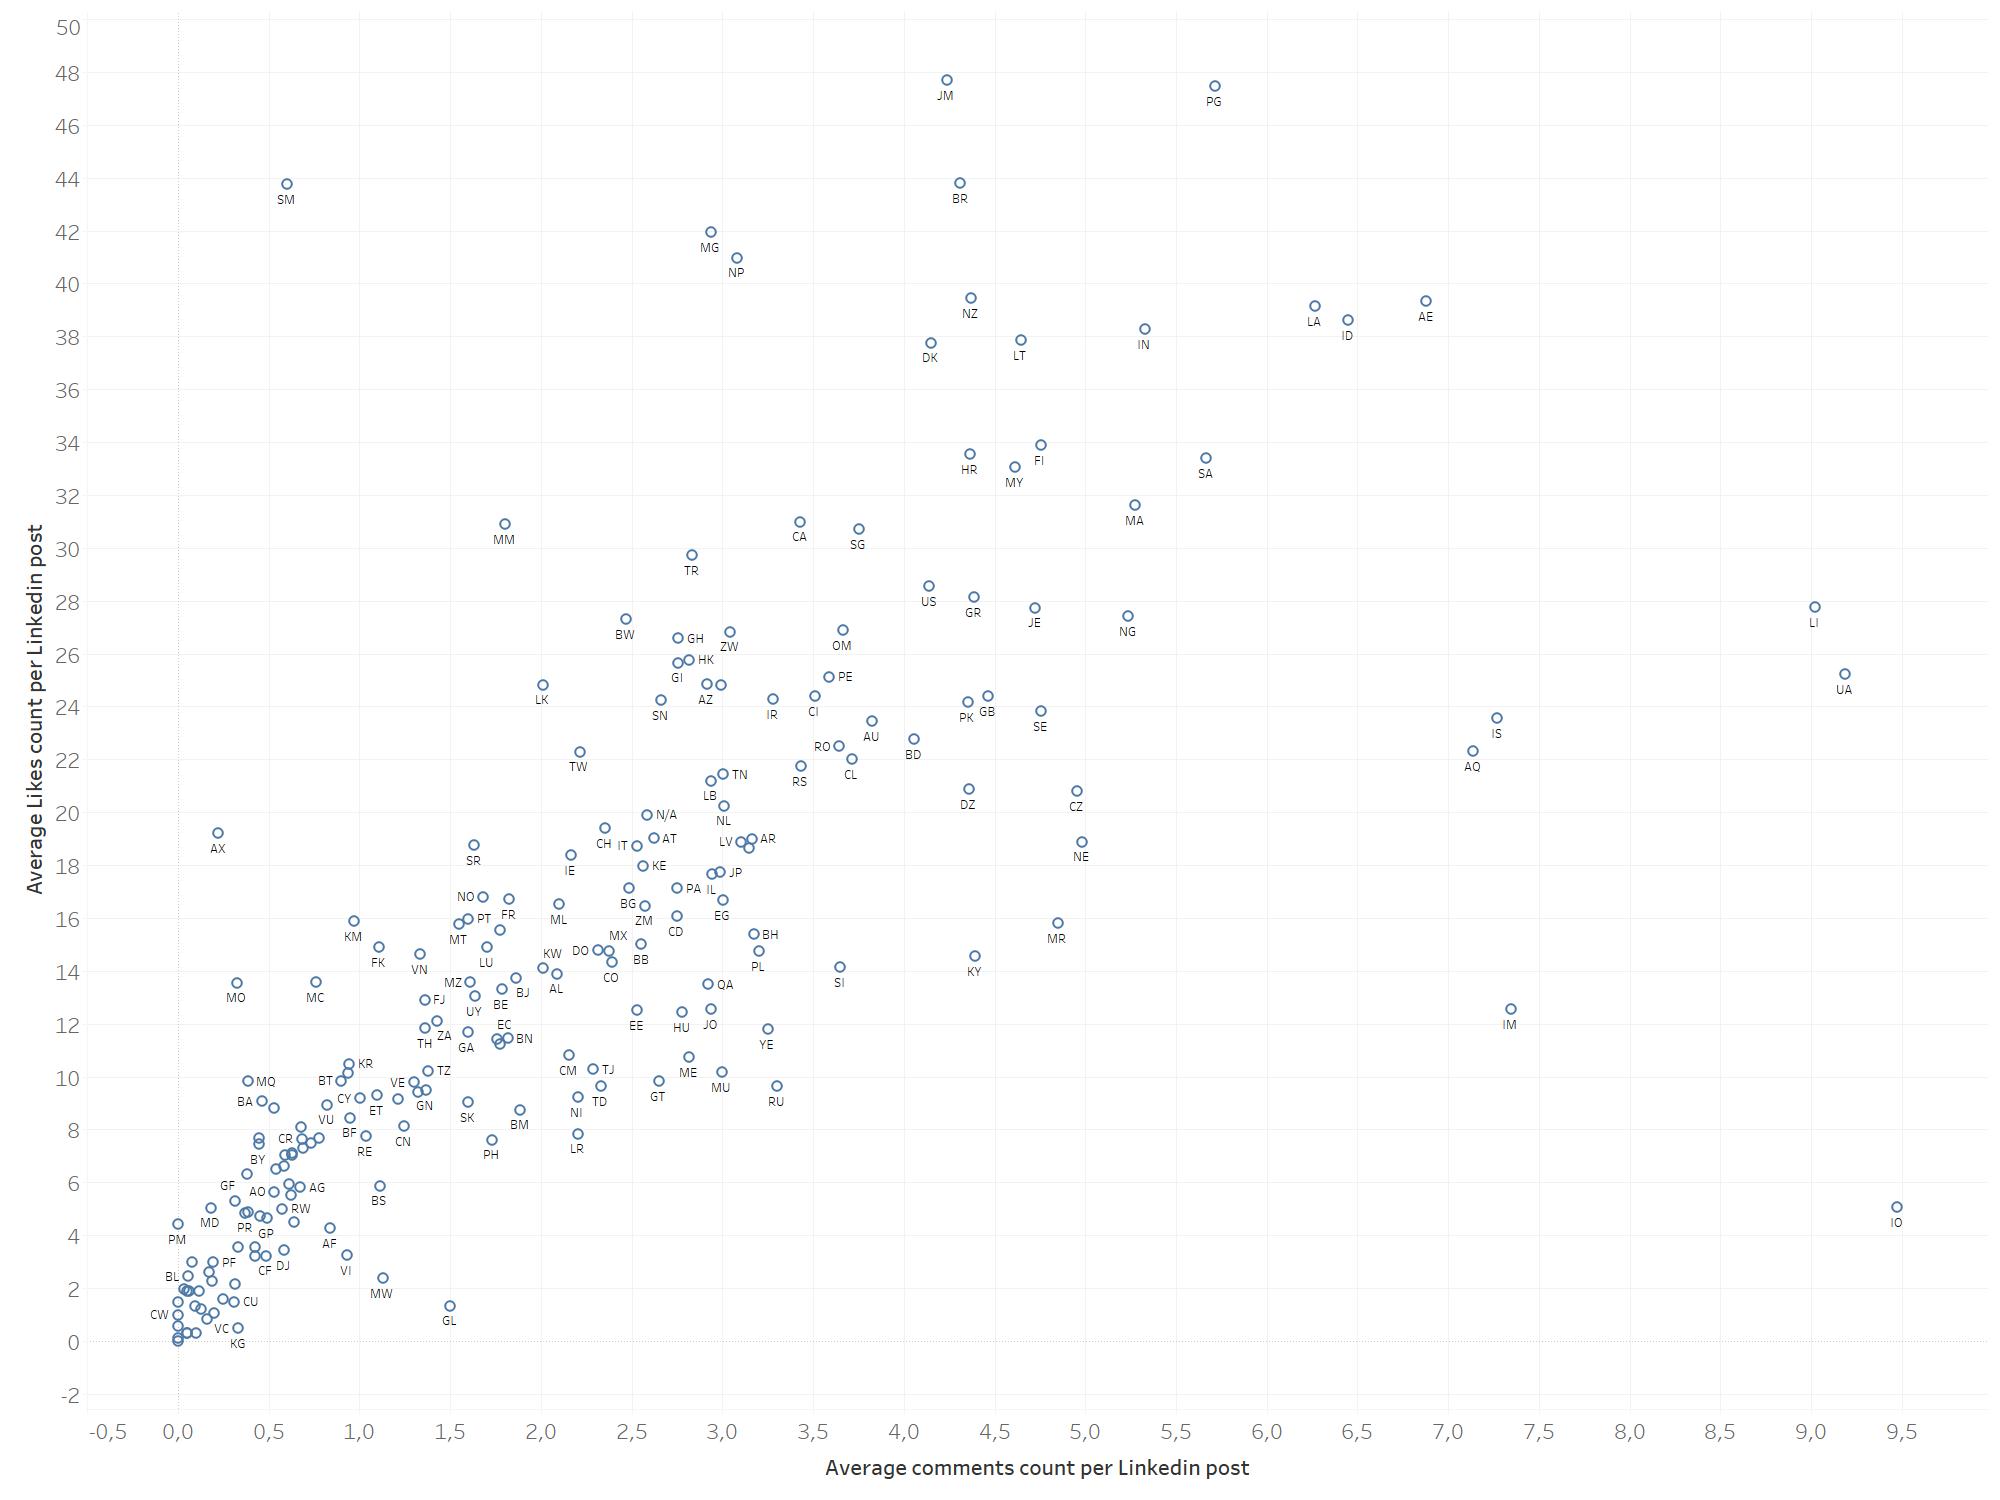
Statistics on comments and likes by country
Finally, I propose to visualize on a “scatter plot” the position of each country regarding the average number of likes and comments.
I had to eliminate some extreme values (Virgin Islands, Tonga, Belize) so that the graph remains usable. For each country of the world, you can access the statistics for the LinkedIn posts published there. Their ISO code indicates the countries. Click on the image to enlarge it.


![Illustration of our post "Free Generative AI Detectors: Which Ones to Choose? [Complete Test 2025]"](/blog/app/uploads/sherlock-holmes-120x90.webp)