What is the purpose of traffic data in market research? Where to find this data for free? I explain everything in this article.

Traffic data is a type of geospatial data. It allows you to quantify the number of people present in a given location. It also provides insight into the routes taken by these individuals, enabling deductions about where they live and work. I have explained how to use this data in the context of a territorial marketing study. In this article, I briefly revisit their use in market research and share resources to access this data for free.
Contact us for your market research
Where does traffic data come from?
The most reliable traffic data comes from permanent counts set up by authorities on specific roads. These counts are most often carried out using cameras. Other types of camera-based counts also exist, such as Telraam. This is a network of cameras installed in private homes that anonymously measure flows. This network is supported by public authorities. Some compile the flows and make them available for free (see an example in Belgium).
Traffic data can also come from your smartphone. You might immediately think of Google Maps or Waze, but Google does not sell this data. However, if you use TomTom, be aware that your (anonymized) location data is sold.
But navigation apps are not the only ones capturing your location data. Free apps you use are likely to track your position via your phone’s GPS chip and sell this data. You can therefore be tracked, and “data brokers” sell this data entirely legally. Always read the terms of use before using a mobile app!
What is the purpose of traffic data in market research?
Traffic data is particularly crucial in B2C market research because it allows you to assess the economic dynamism of a territory. More specifically, it helps understand the appeal of a catchment area.
Understanding the dynamics of a catchment area is the most critical element in retail studies. Traffic data will therefore help you identify the most suitable areas for setting up your business. I published a fairly comprehensive case study for a region in northern France here.
We have successfully used this method for:
- retail location setups
- choosing locations for retirement homes by combining flow data with a competitive analysis in the catchment area
Learn more about our location study services
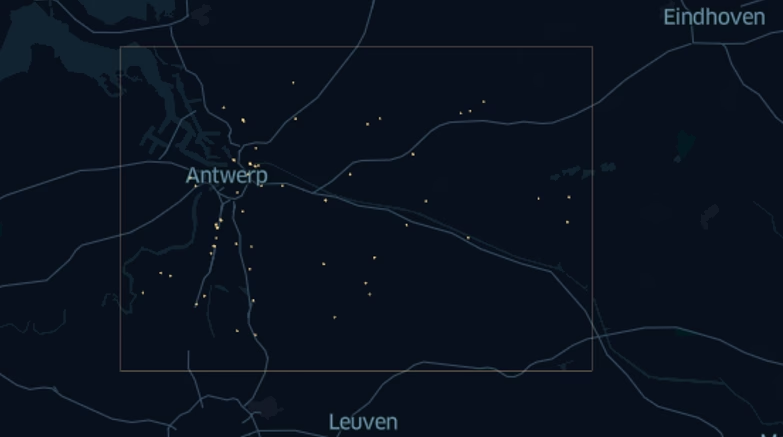
For a client in Belgium, we used smartphone data to analyze traffic in their points of sale and those of their competitors. This allowed us to calculate their market share. We started by identifying all competitors on a map.
Using flow data to calculate market shares
As explained in the introduction, some free apps installed on your smartphone sell your location data. It becomes possible to track groups of people with unprecedented accuracy (+/- 8 meters) and use this precision as a tool to calculate market shares.
The limitation lies in GPS accuracy. But if conditions are met, you can count the number of people entering a point of sale. This makes it possible to compare the footfall of competing points of sale and deduce market share. This is exactly what we did in a Proof of Concept (POC) for a chain specializing in car repairs. Auto repair shops are large enough to allow precise counting. We therefore:
- listed all competitors’ workshops
- modeled them
- measured the flows at each of our client’s points of sale
Adjustments were made afterward, based on certain industry indicators, to refine the sample.
Learn more about calculating market shares using location data
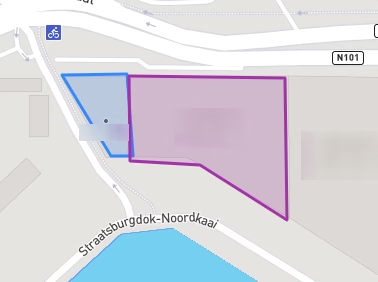
The boundaries of each point of sale were defined to capture all GPS signals inside. The limitation of this method is reached when points of sale are smaller than GPS accuracy or when (as here) two points of sale are adjacent. In the pilot project we conducted for a client, this scenario occurred only once.
Why traffic data remains scarce
Road traffic directly reflects human and commercial activity: more traffic often means more consumption, deliveries, and economic movements. The distances traveled reflect what is called the “catchment area,” the maximum distance most consumers are willing to travel for a given purchase.
However, obtaining traffic data is challenging:
- Statistics provided by TomTom (Traffic Stats) are expensive.
- Google Maps does not provide traffic history.
- Mobile location data (using smartphone GPS) is extremely costly (I will discuss this in another post).
This scarcity limits the use of traffic as a reliable indicator in market research. Fortunately, open data solutions exist, which I explain in the following paragraphs.
Freely accessible traffic data
Fortunately, open data and public projects have brought a breath of fresh air. They now allow the use of traffic data for free in all projects. If you are conducting market research for an urban retail business, consider checking the sites below.
UTD19 Dataset
The UTD19 dataset (https://utd19.ethz.ch) was designed to address this gap. It offers:
- Coverage of 40 cities
- 4.9 billion recorded vehicles
- 170 million data rows
- 3.8 years of history
- Measurement intervals of 3 to 5 minutes
The data comes from road sensors managed by local authorities, is fully standardized, and includes error reporting, making it easy to use. The methodology and results have been published in Scientific Reports.
City-specific datasets
On this site, you will find an updated list of various datasets available for free to study traffic in cities around the world. Unlike UTD19, the datasets listed on Github are not uniform in terms of variables. If you want to compare two cities, I recommend carefully checking that the data is comparable.
Reference sites
For those who want to go further, here are some open data sources I recommend:
- UTD19 dataset: utd19.ethz.ch
- UK counts (Department for Transport): roadtraffic.dft.gov.uk/downloads
- Updated list of cities worldwide offering open access datasets: https://github.com/graphhopper/open-traffic-collection