

This article provides an in-depth analysis of the cruise market, its spectacular growth over the past 40 years, and its future prospects. Numerous charts will help you understand the challenges of this market as well as the divide between two economic models and two positioning strategies.
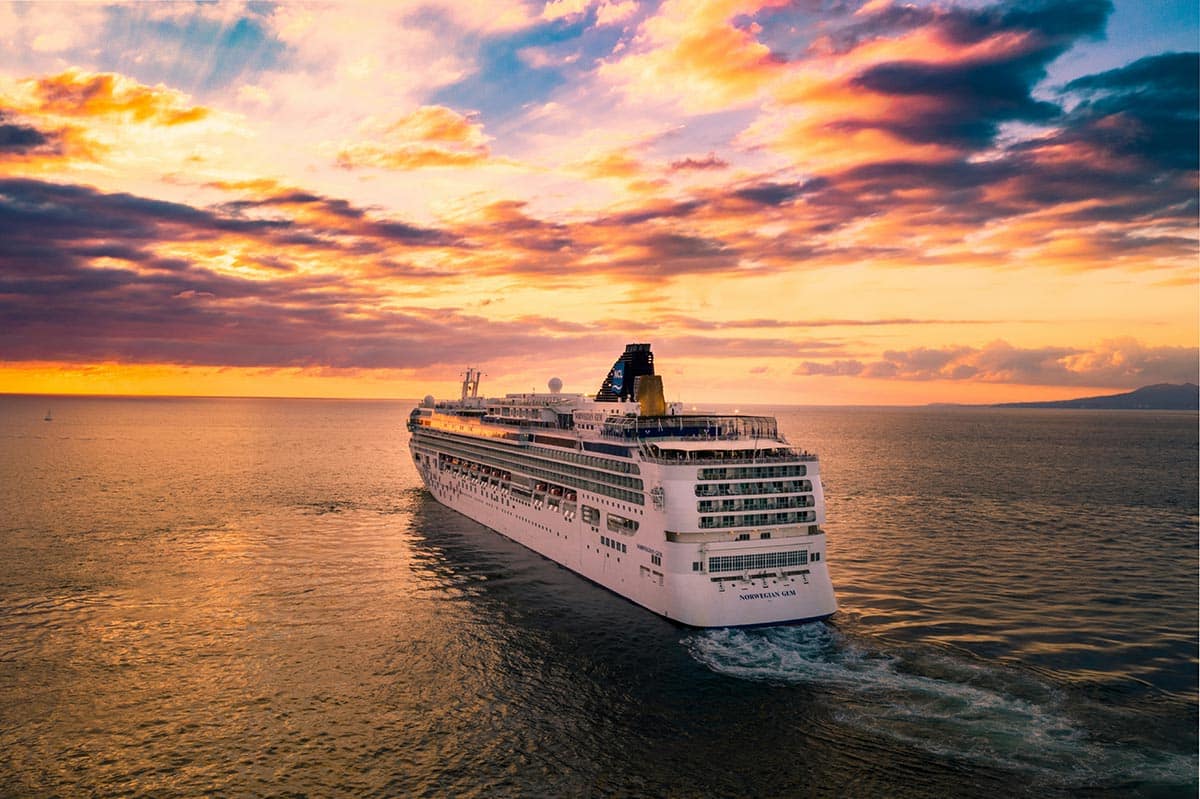
When I go on holiday to Italy (in the Marche region), I often see these huge cruise ships out at sea. The port of Ancona is an important hub. Although I have never travelled on this type of ship, I have to admit that I find it appealing. I therefore decided to take a closer look at this market and, in this article, I present an in-depth analysis of the cruise market (with plenty of charts to help you understand everything 😊). I must say that I was surprised by what I discovered. In particular, the cruise market is showing a remarkable growth trajectory within the tourism industry. The number of cruise passengers worldwide increased from 1.9 million in 1985 to 37.2 million in 2025. The industry’s professional association (CLIA) forecasts 38.3 million passengers in 2026 and 42.1 million in 2029. I also discovered that this market is structured around a fundamental dividing line: the ship as a destination in itself, or the ship as simply a gateway to the world. These two approaches produce radically different business models, customer profiles and ship configurations. Drawing on IntoTheMinds’ sector expertise in tourism, I have therefore combined business with pleasure by analysing all the available data to provide you with a concise overview of this market.
Key takeaways
- 37.2 million passengers worldwide in 2025, the third consecutive record, with +7.5% year-on-year growth and 42.1 million expected in 2029.
- The United States alone accounts for 55% of the global market (20.6 million passengers).
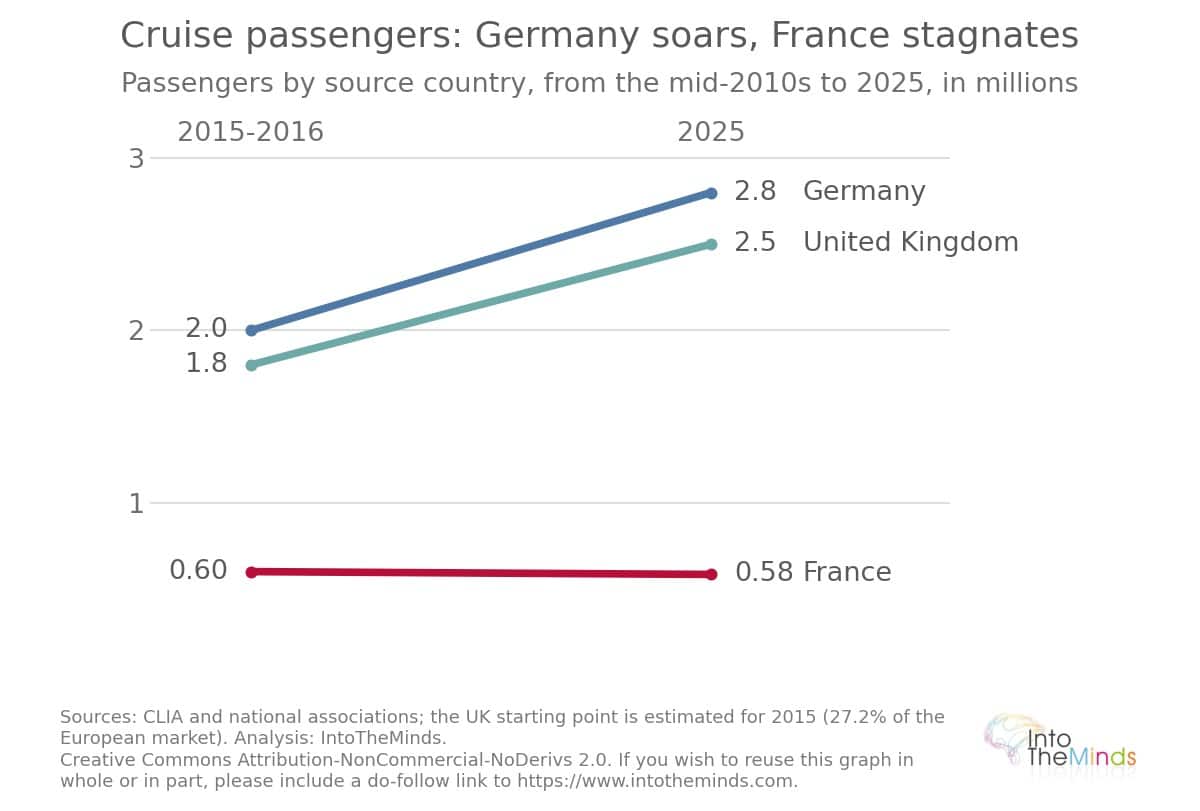
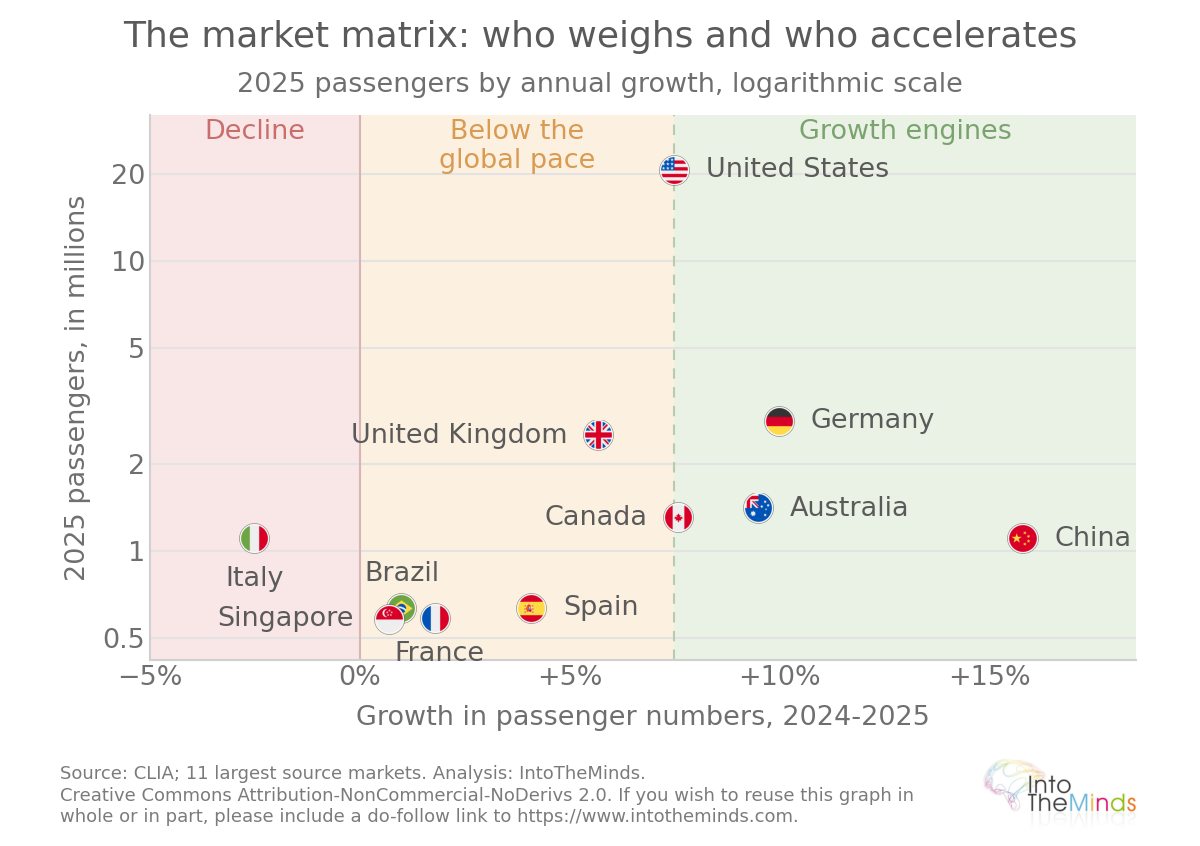
- Germany is the leading European market (2.8 million, +10%), ahead of the United Kingdom (2.5 million). France has returned to the global top 10 with 583,600 cruise passengers (+1.8%).
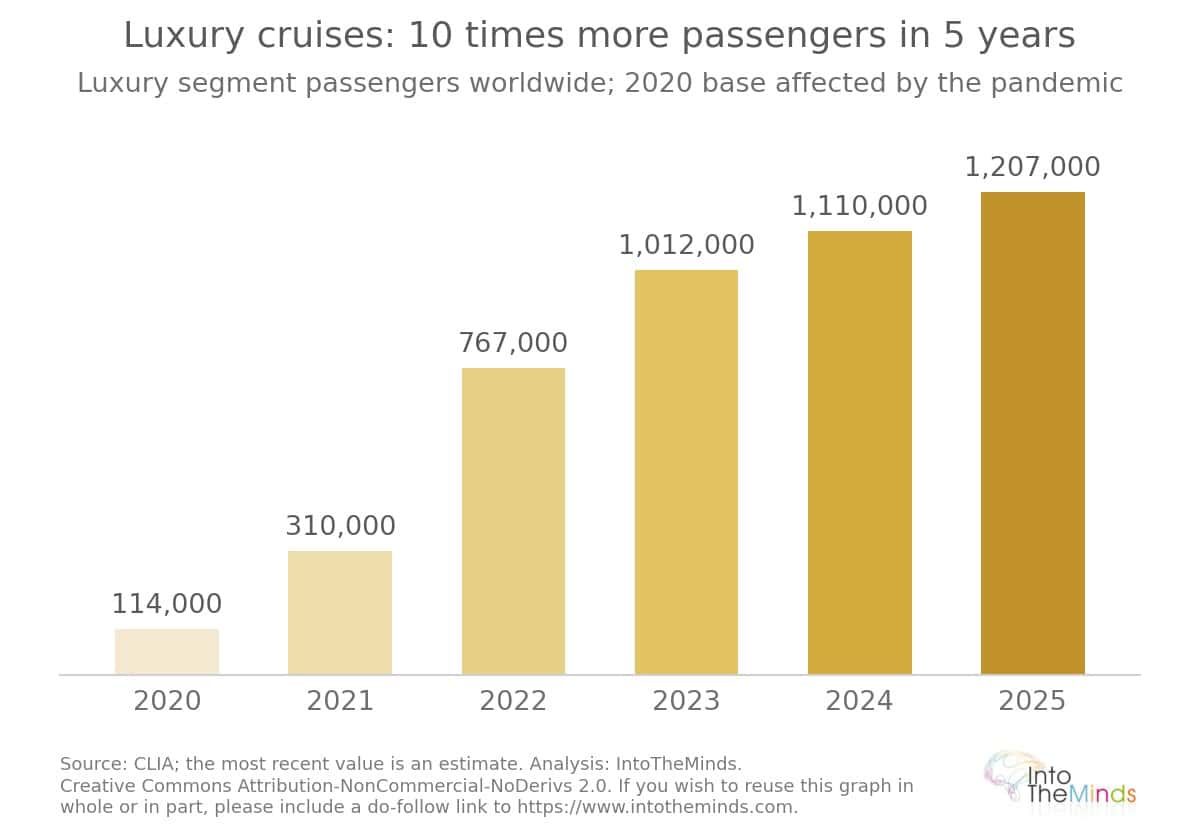
- The luxury segment grew from 114,000 passengers in 2020 to 1,207,000 in 2025, representing a more than tenfold increase in 5 years.
- The industry’s global economic impact reached $168 billion in 2023, including $85.6 billion in contribution to global GDP.
- In Europe, the economic contribution reached €64.1 billion in 2024 (+16%), supporting 445,000 jobs. (Sources: CLIA, internal analyses)
A Record-Breaking Global Market, Structured as a Geographical Funnel
Below you will find an overview of the cruise market organized from the global level down to national markets, in order to place each figure in context. This funnel approach makes it possible to understand where growth is actually taking place and which markets deserve particular attention.
Global Cruise Market Dynamics Since 1985
The growth of the cruise market over the past 40 years is unparalleled in tourism. The table below traces the major stages of this growth, including the shock caused by the 2020–2021 pandemic (source: CLIA).
| Year | Global passengers (millions) | Annual change |
|---|---|---|
| 1985 | 1.9 | n.a. |
| 2005 | 11.3 | n.a. |
| 2015 | 21.6 | +17.4% |
| 2019 | 29.7 | +4.2% |
| 2020 | 5.8 | -81% |
| 2021 | 4.8 | -17.2% |
| 2022 | 20.4 | +325% |
| 2023 | 31.7 | +55.4% |
| 2024 | 34.6 | +9.1% |
| 2025 | 37.2 | +7.5% |
| 2026 (forecast) | 38.3 | +3.0% |
| 2029 (forecast) | 42.1 | n.a. |
To put this history into perspective, the Covid shock of 2020 remains the most severe disruption the sector has ever experienced. Remember the Diamond Princess, which departed Yokohama on January 20, 2020. There were 2,666 passengers and 1,045 crew members on board. In the end, more than 700 people were infected and around ten died. A further 58 deaths were subsequently recorded across 9 comparable ships before the global shutdown on April 23, 2020. To give you an idea of the financial impact, Carnival lost $4.4 billion in the second quarter of 2020 alone!
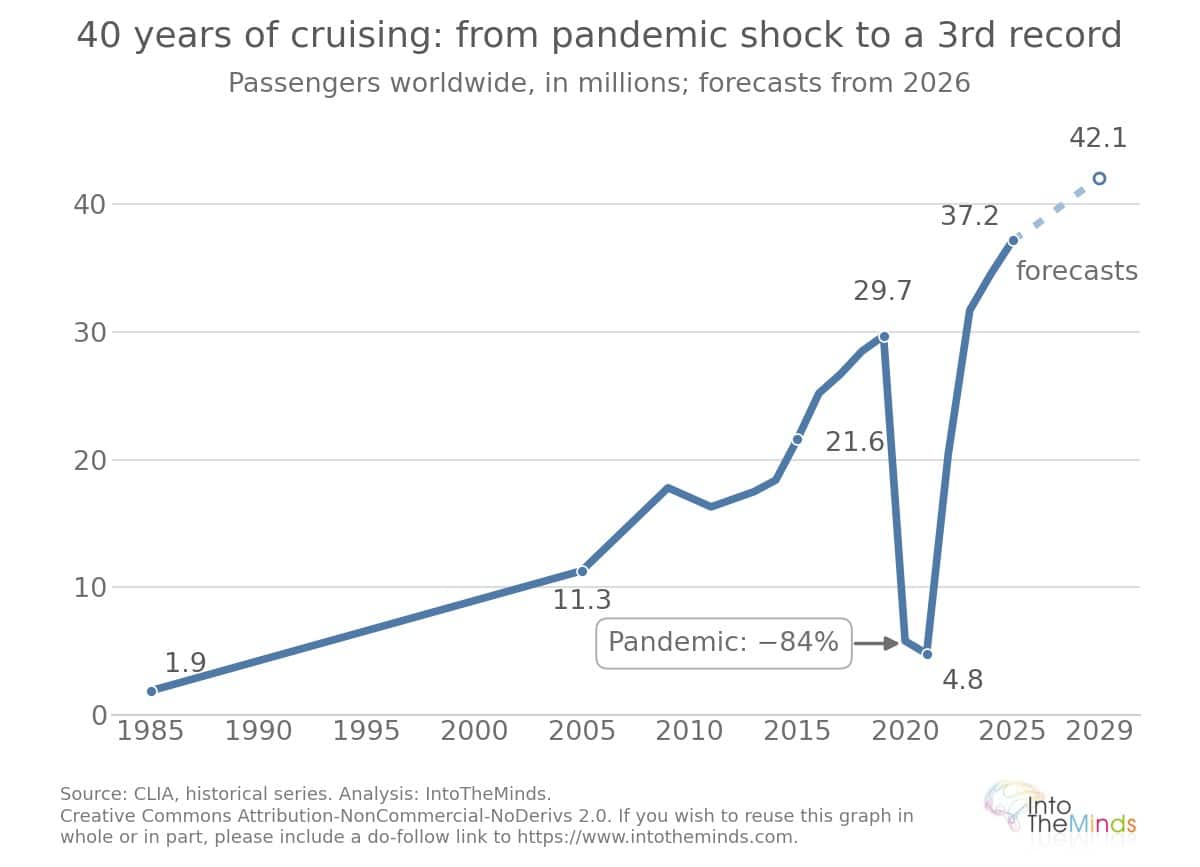
What is equally remarkable is the sector’s recovery since 2022: the 35 million passengers forecast for 2026 were already reached in 2025.
37.2 million cruise passengers in 2025: the market has multiplied twentyfold in 40 years.
The global geographical distribution of demand in 2025
Any good market research study needs figures. Apologies in advance for using so many figures in a single paragraph, but I believe this is a necessary prerequisite for understanding the rest of the analysis.
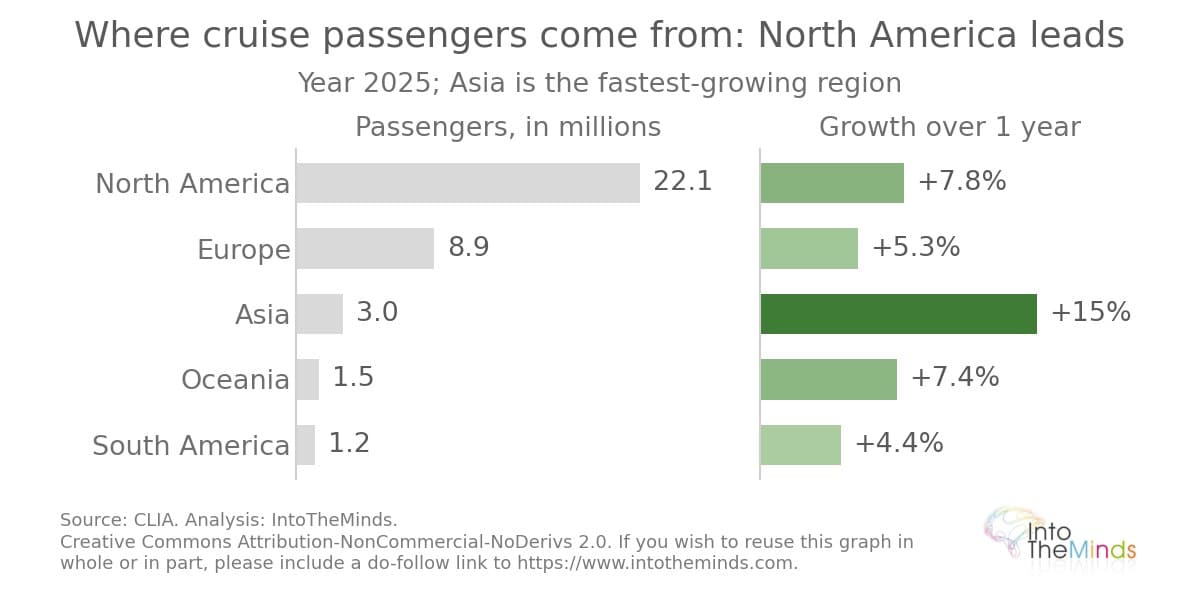
- North America dominates the global market with 22.1 million passengers in 2025 (+7.8%)
- Europe ranks second (8.9 million, +5.3%)
- Asia is experiencing a clear recovery, rising from 2.6 to 3 million passengers (+15%)
- Oceania (1.5 million, +7.4%) and South America (1.2 million, +4.4%) bring up the rear.
The United States alone accounts for 55% of the global market, with 20.6 million passengers (source: Seatrade Cruise News). This imbalance is structural and can be explained by the all-inclusive culture, proximity to the Caribbean, and the density of cruise offerings departing from Miami.
To put these figures into a broader context, below are two charts illustrating the distribution of demand.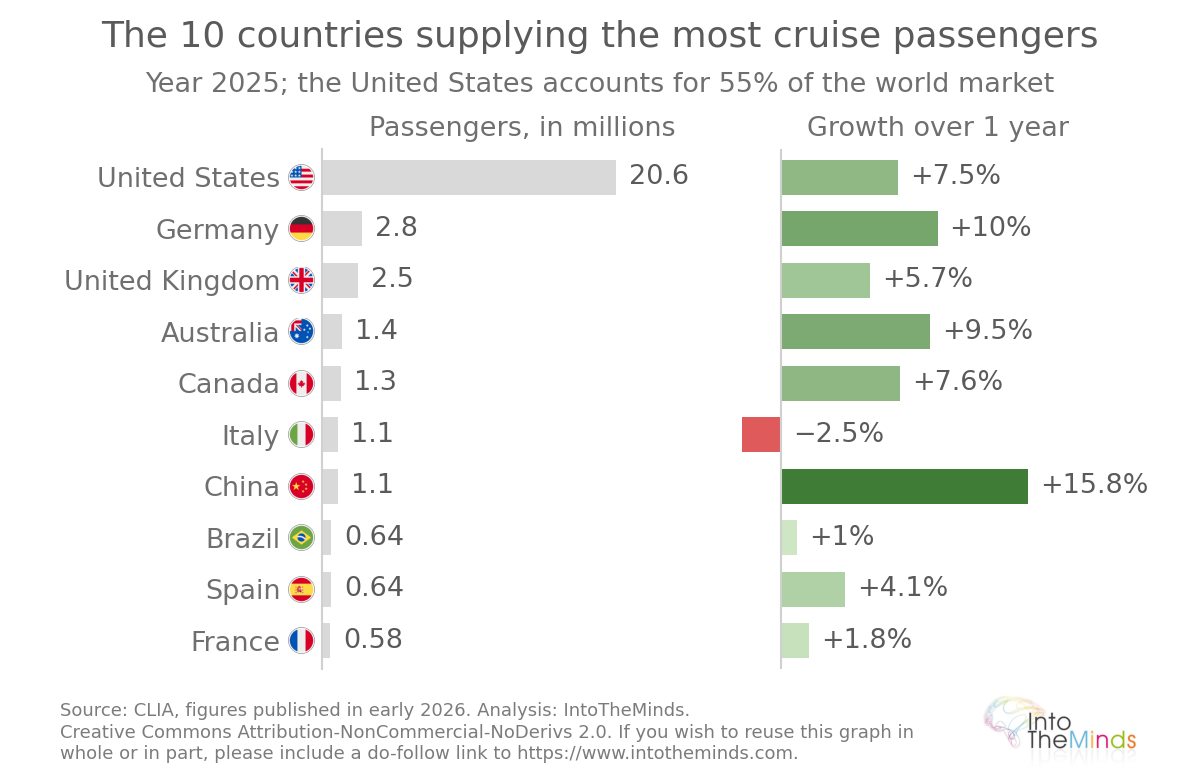
Europe and its national markets
Europe is the second-largest region in terms of market size for the cruise industry. As you will see below, national dynamics vary considerably. Some mature markets are showing sustained growth, while others, such as France, are undergoing a transition.
Germany, Europe’s leading cruise market
Germany is consolidating its position as Europe’s leading cruise market, with 2.8 million cruise passengers in 2025, up 10% year on year (source: CLIA). This figure represents more than one in twelve cruise passengers worldwide. Growth has been steady: there were 1.8 million German cruise passengers in 2015, 2 million in 2016, and 2.5 million in 2023. The average price of a cruise in this market reached €1,800 in 2018, clearly positioning Germany in the mid-range to premium segment.
A market research study conducted in 2014 among more than 5,000 German cruise passengers already showed high levels of satisfaction:
- only 8% of respondents expressed a negative opinion
- the satisfaction rate was 92% for cabins and 89% for food and dining.
- 17% of respondents criticized the value for money
The United Kingdom, a market driven by volume and loyalty
The United Kingdom and Ireland accounted for 27.2% of the European cruise market in 2015, ranking second on the continent. In 2025, the UK market reached 2.5 million passengers (+5.7%), a steady increase that confirms the strong cultural roots of cruising in British travel habits. The proximity of Mediterranean embarkation ports and the long-standing tradition of sea travel explain this market’s structural resilience.
France returns to the TOP 10 of the cruise market
France has returned to the global top 10 with 583,600 cruise passengers in 2025 (+1.8%), after 573,000 in 2024, 545,000 in 2019 and 600,000 in 2016 (source: L’Écho Touristique). Some nuance is nevertheless needed:
- growth remains modest compared with Germany (+10%)
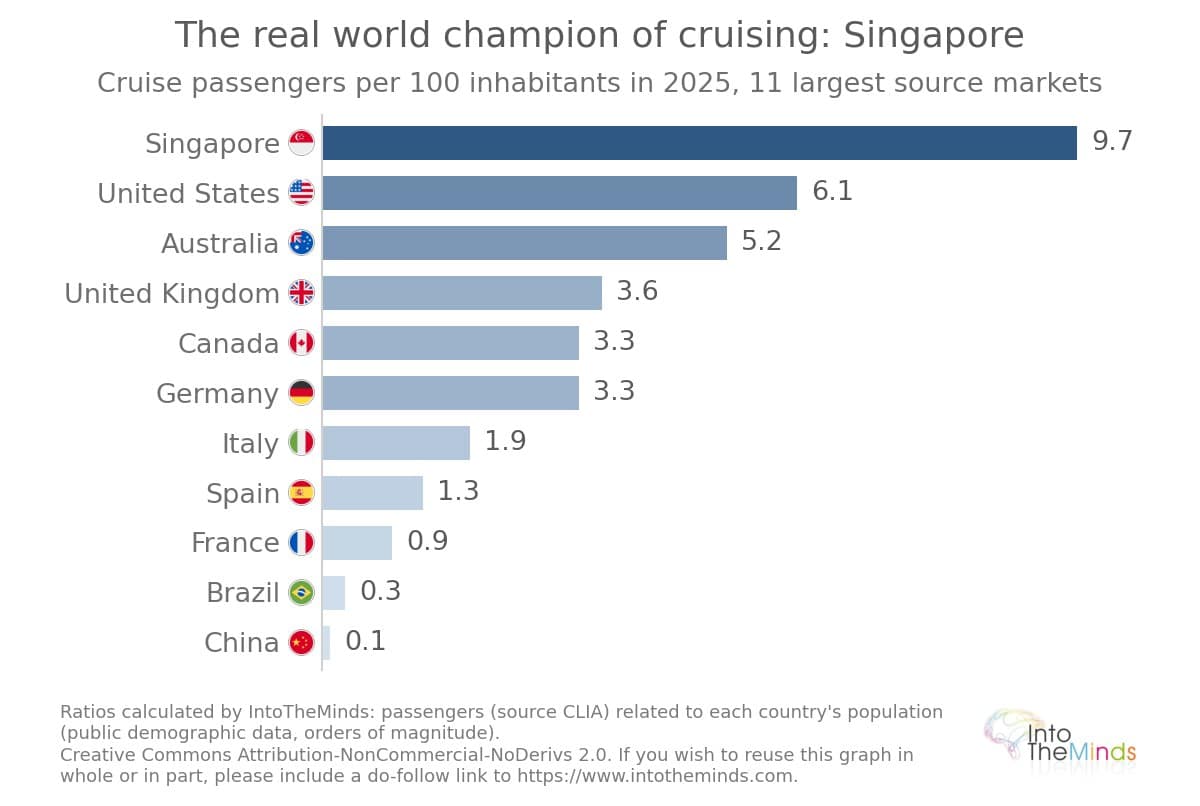
- France is now closely followed by Singapore (580,000 passengers, +0.7%), whose penetration rate is remarkable for a country of barely 6 million inhabitants.
Here are some other interesting figures on cruise demand in France:
- 90% of sales were captured by Costa and MSC in 2023. This therefore represents an almost duopolistic market structure.
- Costa held a 29.5% market share in 2025, with an average price of €540 to €760 per person.
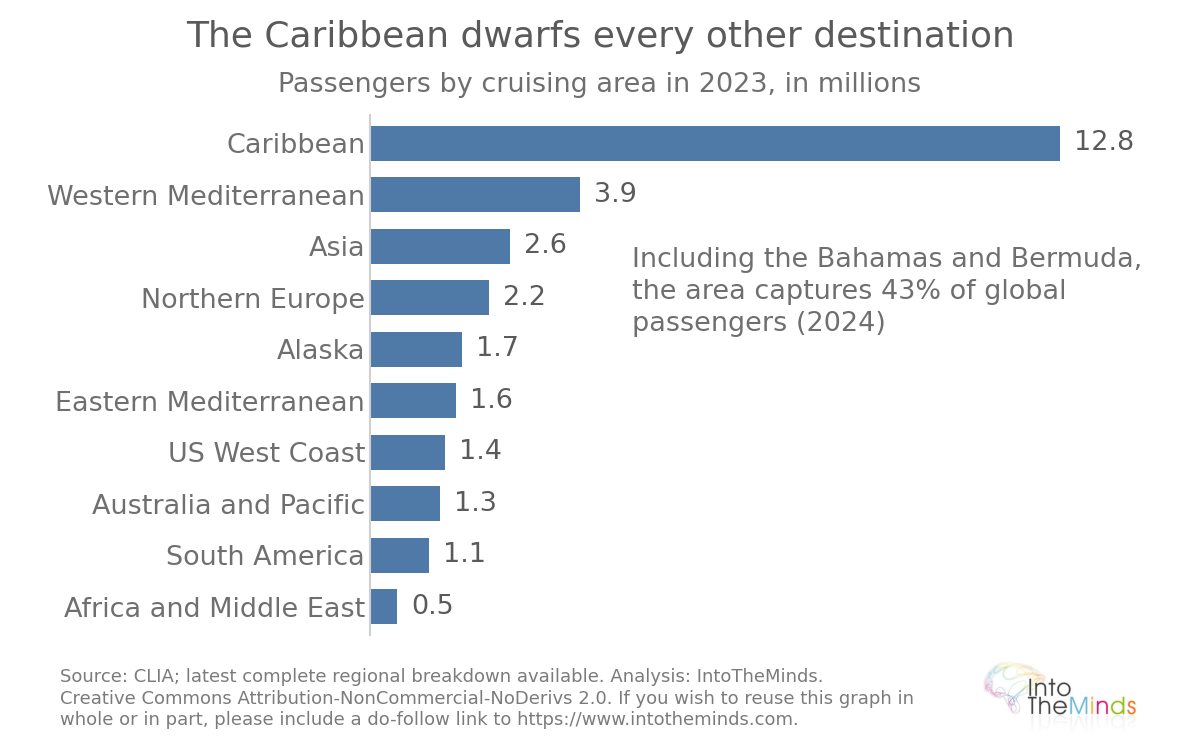
- the Mediterranean accounts for 63.7% of departures (2024), ahead of the Caribbean (21.1%) and Northern Europe (5.5%).
- 67.3% of searches are for cruises costing less than €1,000, but the premium segment (€1,500 and above) already accounts for 13% of demand.
90% of cruise sales in France were captured by Costa and MSC in 2023. This therefore represents an almost duopolistic market structure.
The cruise industry has a significant economic impact in France:
- a €6.35 billion market in 2024
- €2.6 billion in contribution to France’s GDP
- 28,300 jobs
- €1.55 billion in wages (source: L’Écho Touristique).
- Local impact: passenger spending amounts to approximately €100 per day and per destination. For the port of Marseille, the estimate ranges from €57 to €87 per passenger.
- La construction des navires de croisière représente à elle seule 2 milliards d’euros. La France est donc un acteur industriel de premier plan (grâce notamment aux Chantiers de l’Atlantique), mais pour combien de temps encore ? Ce savoir-faire ne risque-t-il pas d’être copié (puis dépassé) par les Chinois, comme ils l’ont fait dans le domaine de la voiture électrique ?
Du côté de la demande, les signaux sont encourageants :
- 8 Français sur 10 souhaitent repartir en croisière
- plus des 2/3 envisagent de le faire dès l’année suivante. Ce taux de fidélité est l’un des plus élevés de toute l’industrie touristique.
| Rang 2025 | Pays émetteur | Passagers 2025 | Variation 2024-2025 |
|---|---|---|---|
| 1 | United States | 20.6 million | +7.5% |
| 2 | Germany | 2.8 million | +10% |
| 3 | United Kingdom | 2.5 million | +5.7% |
| 4 | Australia | 1.4 million | +9.5% |
| 5 | Canada | 1.3 million | +7.6% |
| 6 | Italy | 1.1 million | -2.5% |
| 7 | China | 1.1 million | +15.8% |
| 8 | Brazil | 635,000 | +1% |
| 9 | Spain | 635,000 | +4.1% |
| 10 | France | 583,600 | +1.8% |
| 11 | Singapore | 580,000 | +0.7% |
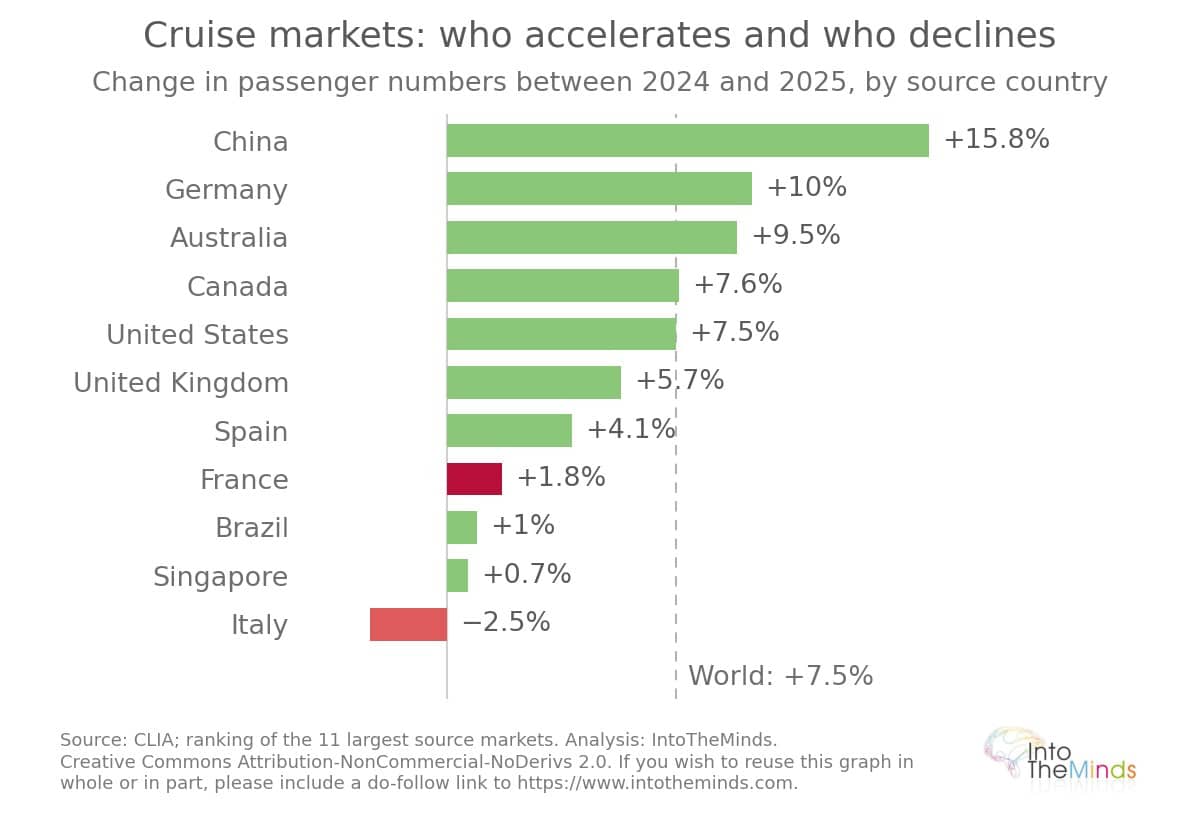
Italy is the only one of the ten largest source nationalities to decline in 2025, with a 2.5% decrease in cruise passengers.
Ship as destination or gateway to the world: 2 business models
Let me now develop the thesis I introduced at the beginning: the opposition between 2 cruise models:
- the first sees cruise ships as destinations in their own right
- the second assumes that the ship is not the destination, but simply a means of enjoying the destination.
These two models coexist in the market. They determine how the following are distributed:
- business models
- customers
- ship profiles
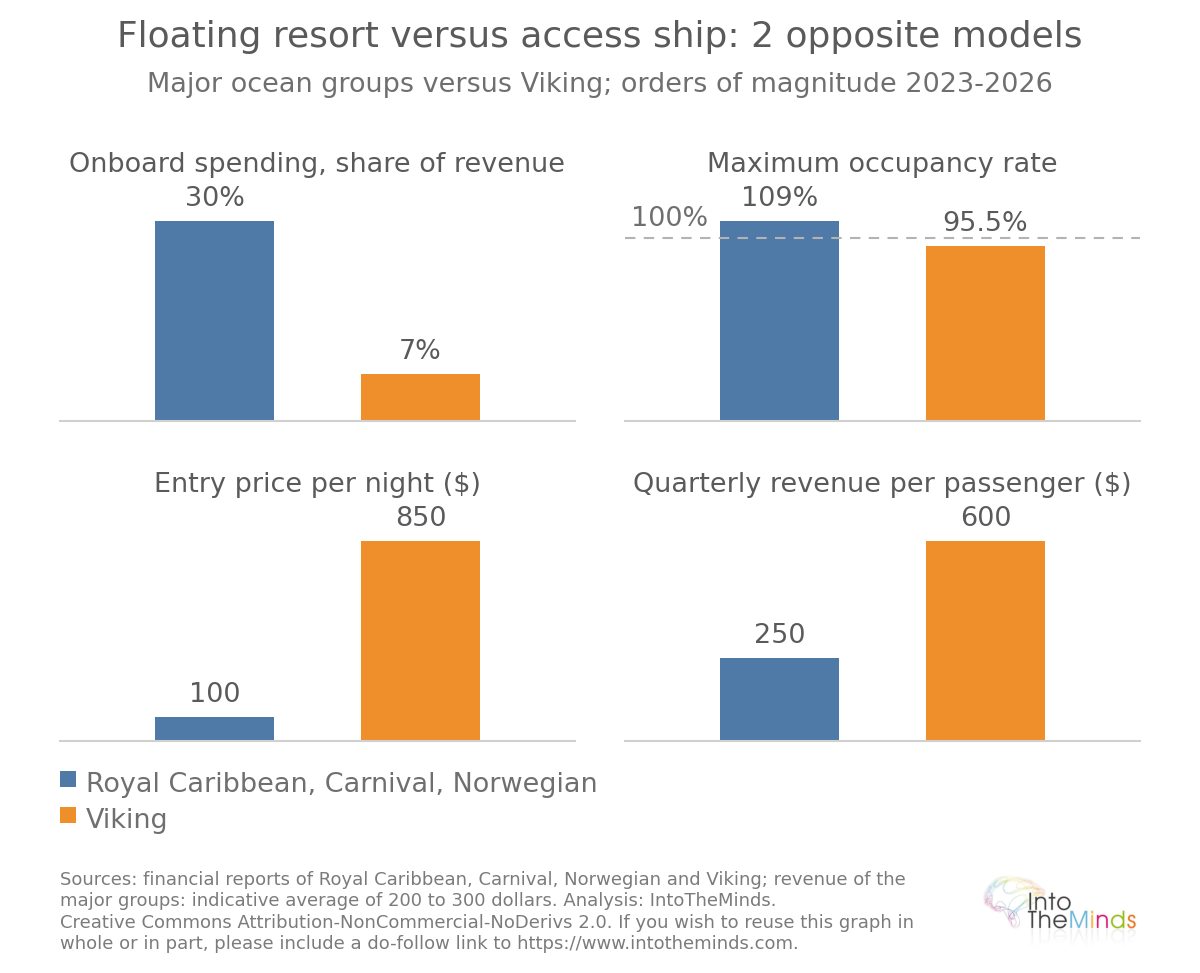
I have tried to summarize this structure in the table below.
| Indicator | Ship-as-destination segment (Royal Caribbean, Carnival, Norwegian) | Destination-first segment (Viking) |
|---|---|---|
| Share of onboard spending in revenue | approximately 30% | less than 7% |
| Revenue per passenger | reference level | double or triple (approximately $600 per quarter) |
| Target occupancy rate | over 100% (up to 109% at Royal Caribbean in Q1 2026) | 91.7% to 95.5% (2023-2025) |
| Indicative price per person per night | approximately $100 at the entry level | $800 to $900 |
| Construction cost per cabin | $200,000 to $300,000 | approximately $225,000 (river cruising) |
| Growth driver | scale and private islands | access scarcity and loyalty |
Less than 7% of Viking’s revenue is generated onboard, compared with approximately 30% for the three major U.S. groups.
The ship-as-destination segment: the race for scale (and private islands)
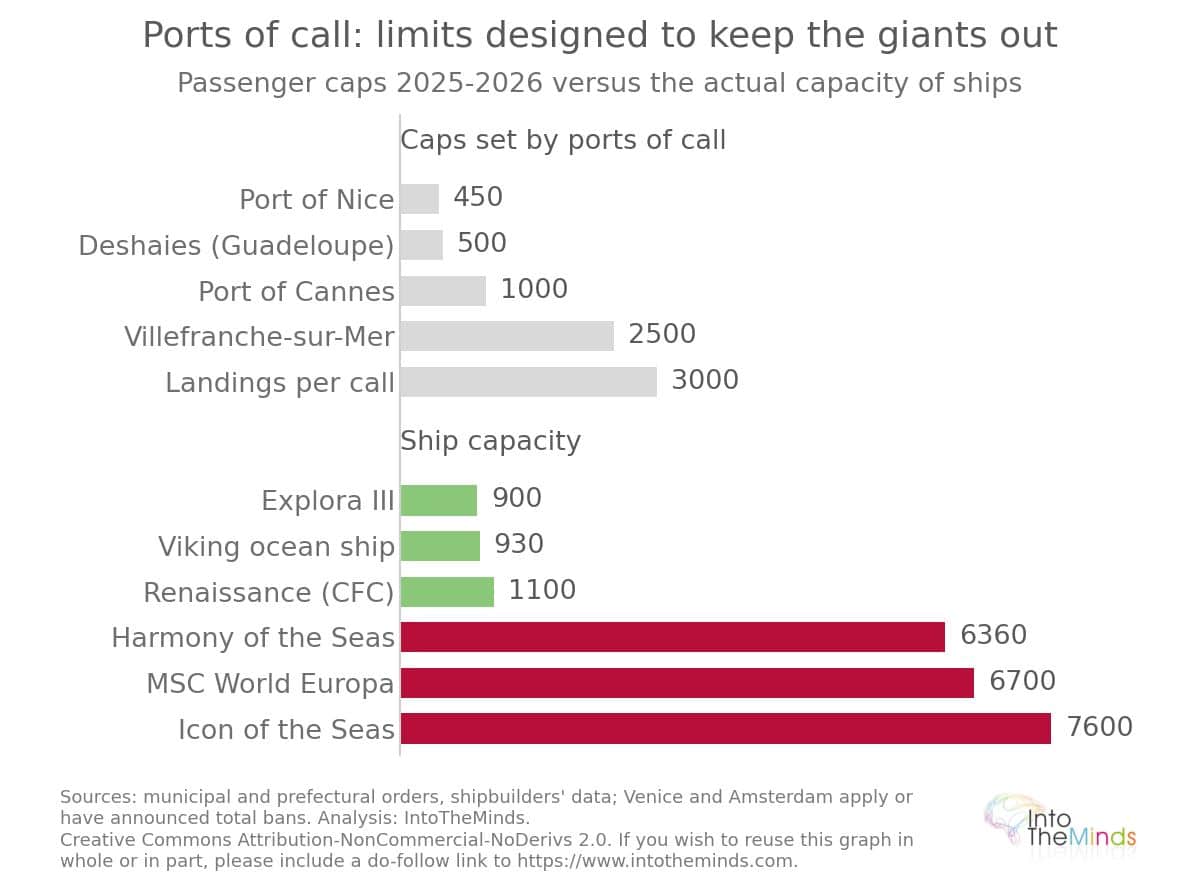
This segment is a relatively recent historical development. The number of cruise ships has increased twentyfold since 1970, while the largest ships are now twice as large as they were in 2000. The shift took place in the 2000s, when standardized cruise ships reached 3,000 passengers. The economic rationale was theorized as early as 2014 by the CEO of MSC Cruises: larger ships reduce operating costs, and this advantage is passed on to customers through lower prices, making a cruise no more expensive than a conventional beach holiday. The ultimate expression of this model is Royal Caribbean’s Icon of the Seas, which entered service in January 2024: 7,600 passengers, 365 meters, twenty decks, forty restaurants and seven swimming pools, at a cost of $1.5 billion—five times the size of the Titanic. MSC World Europa (2022) accommodates 6,700 passengers, and in 2025, 21.1% of the global fleet had a capacity of more than 3,000 passengers. The share of ships with more than 4,000 berths is expected to rise from 12% in 2024 to 15% in 2028.
The ultimate extension of the ship-as-destination model is the private island: an artificial destination controlled from end to end. Royal Caribbean invested $250 million as early as 2019 in its private island in the Bahamas, later complemented by an adults-only beach club. Carnival is betting on Celebration Key in Grand Bahama to stimulate demand, while Norwegian completed the first phase of development at Great Stirrup Cay in 2025-2026. The customer base is following suit and getting younger: 31% of cruise passengers were first-time cruisers in 2024, one in two Royal Caribbean passengers was a millennial or younger, millennials and Generation Z accounted for 36% of the global market, around one-third of cruise passengers were under 40 in 2025, and three- to four-day itineraries are designed as trial products, including Utopia of the Seas, financed through a $1.5 billion loan for Caribbean mini-cruises.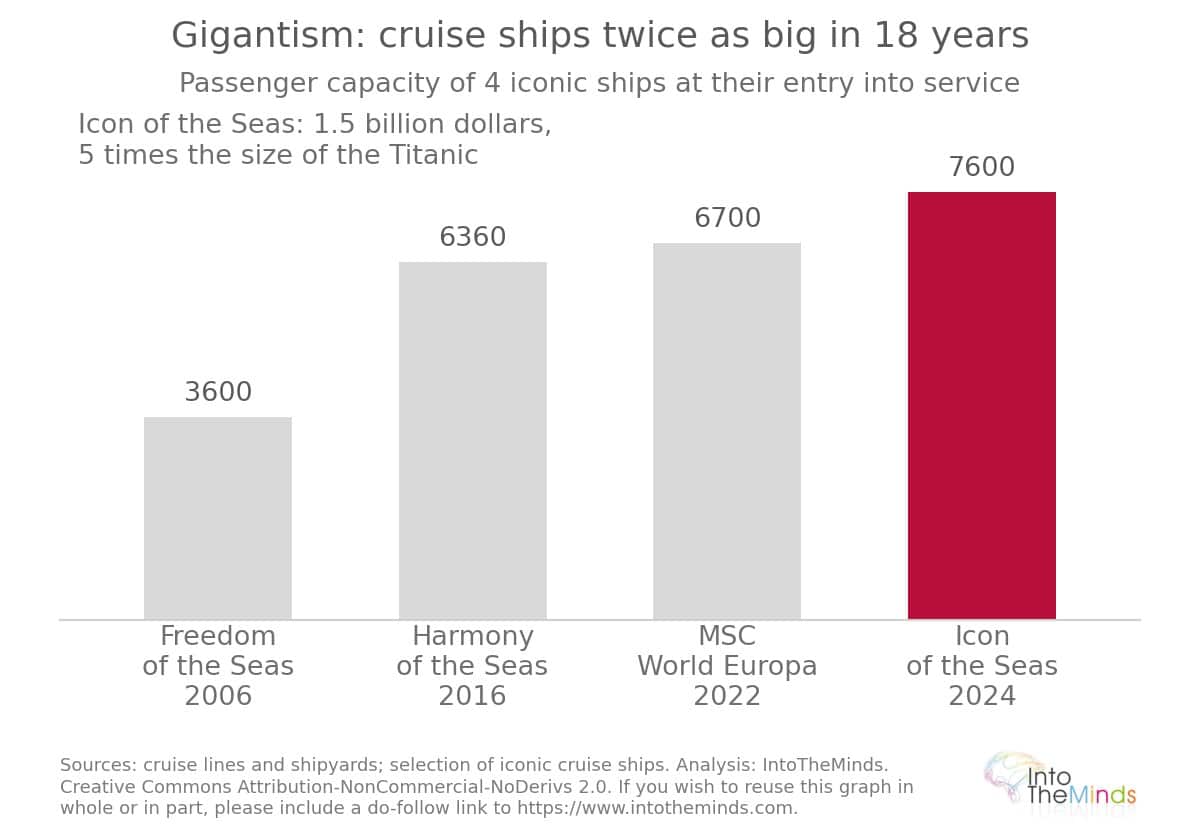
The destination-first segment: Viking, river cruising and expedition cruises
The opposite model has found its economic laboratory at Viking (I am not sponsored by them, but if they want to invite me, I’m in 😀):
- no passengers under 18
- customers aged 55 and over
- historian-led lectures instead of casinos
- more than 90 river ships operating on 21 rivers, with priority access to around 110 docking locations
- more than 100 ships in total.
You can see that the marketing positioning is completely different from that of the first model (see also the video below). But the results speak for themselves:
- $6.5 billion in revenue in 2025 (+21.9%)
- 86% of 2026 capacity had already been sold by mid-February 2026 (source: Seeking Alpha).
Expedition cruising follows the same logic of scarcity. Expedition and exploration cruises grew by 22% in 2024, and global capacity is expected to more than double by 2029. Antarctica, where no more than 100 people are allowed to go ashore at the same time, mechanically requires smaller vessels. We are talking about 36 passengers on Selar and 144 on Exploris. Here are a few figures that I believe reflect the strong health of this type of cruising:
- Prices first: $25,780 for 14 days in Greenland, and around $50,000 for 23 days in the Arctic (to be considered alongside occupancy rates).
- In France, searches for Alaska cruises jumped by 275% in 2025.
- Antarctica visitor numbers have quadrupled.
- The average spend is €5,820 per person (source: Tour Hebdo).
CroisiEurope applies the same principle with 50 ships operating between Europe, the Mekong and Africa, while Compagnie Française de Croisières applies it to the accessible cultural segment, with trips averaging twelve nights and costing between €105 and €240 per day.
Hotel yachts: escaping the crowds
A third space has emerged since 2022. What I find interesting is that this sector:
- stems from the very saturation created by the large ships themselves
- demonstrates the permeability between the luxury hotel sector and the cruise industry.
Let me explain.
Let’s start with the founding paradox. Large ships have contributed to overcrowding in cities such as Venice, Barcelona and Santorini. Mass tourism acts as a deterrent for the wealthiest travelers. And affluent customers are now willing to pay to escape these crowds by taking to the sea again. Naturally, since these customers have expectations commensurate with their means, the ships are… special. They are yachts that provide exclusive access to destinations:
- Ritz-Carlton Yacht Collection pioneered the concept in 2022 (I included a video above)
- Four Seasons followed
- And now Orient Express and Aman are entering the game.
These yachts combine both models:
- they are destinations in their own right
- but they also provide easy and direct access to highly sought-after destinations.
Space is the ultimate luxury. And a ship also needs to be large (nearly 900 passengers on Explora III) to provide the gastronomy and entertainment expected on board. The pricing benchmark supports the comparison with land-based luxury: from $6,800 to nearly $90,000 for a European voyage with Ritz-Carlton.
Competitive structure and high-potential segments
The two segments described above are reflected in the financial performance of the main groups (see the table below for the 2025-2026 period).
| Group | 2025 revenue | Capacity at end-2026 | Positioning |
|---|---|---|---|
| Carnival Corporation (Carnival, Costa, Princess, Holland America, Seabourn, Aida…) | $26.6 billion | 94,402 berths (Carnival alone) | Global multi-brand volume |
| Royal Caribbean Group (RCI, Celebrity, Silversea) | nearly $18 billion | 114,417 berths (RCI alone) | Volume and mega-ships |
| Norwegian Cruise Line Holdings (NCL, Oceania, Regent) | $9.8 billion | 63,798 berths, 36 ships | Volume and luxury |
| MSC Cruises (+ Explora Journeys) | not disclosed (privately held group) | 88,394 berths, 27 cruise ships | European volume, emerging luxury |
| Viking | $6.5 billion | more than 100 ships | Premium destination, 55+ |
Carnival Corporation generated record revenue of $26.6 billion in fiscal 2025. Net income exceeded $3.1 billion, up more than 60% (source: Barchart). These margins are the result of a spectacular deleveraging process. The group’s debt fell from approximately $36 billion to $26 billion between 2022 and 2026. A $2.5 billion share buyback program was implemented. Viking, meanwhile, generates $6.5 billion in revenue with ships that are ten times smaller, thanks to revenue per passenger of approximately $600 per quarter, or two to three times that of the major groups.
The luxury segment deserves particular attention: it grew from 114,000 passengers in 2020 to 1,207,000 in 2025, more than a tenfold increase (see chart below). Prices peak at more than $25,000 per night for Regent’s Seven Seas Prestige Suite, which was booked for 6 of the first 13 departures as soon as sales opened, and at $50,000 per night for the Four Seasons penthouse. This segment is attracting strong interest: four hotel brands have entered the market in four years (Ritz-Carlton Yacht Collection, Four Seasons, Orient Express and Aman).
The dead zone of the mid-market
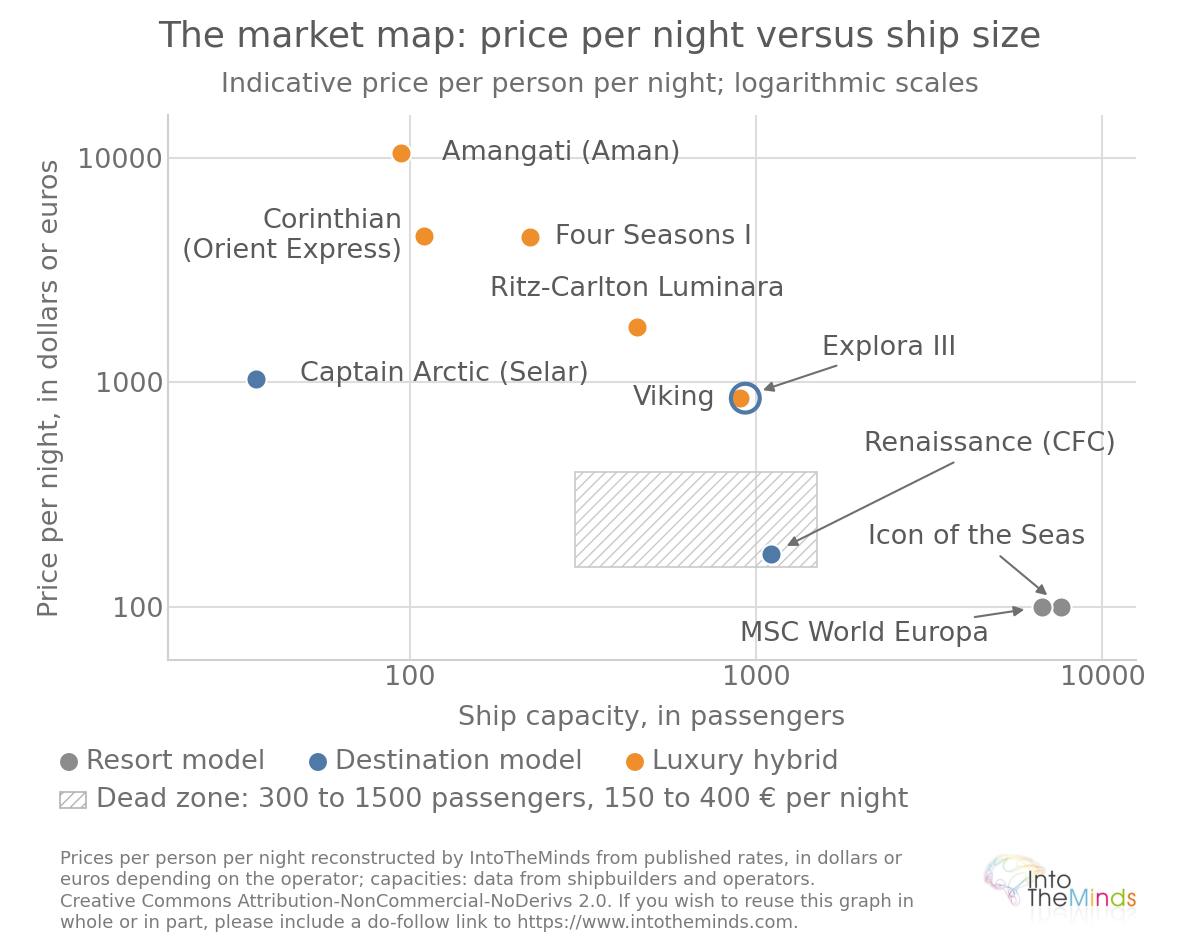
If you read this blog regularly, you will not have missed the fact that I have been repeating for years that the mid-market is a damaging positioning. The same applies to the cruise market. Between the two extremes (low-cost on one side and luxury on the other) lies the most dangerous zone of the market. This concerns ships carrying between 300 and 1,500 passengers, sold at between €150 and €400 per night. They are too small for the resort model (no economies of scale and insufficient onboard monetization), yet not premium enough to capture the destination premium. Compagnie Française de Croisières operates alone in this segment with its 1,100-passenger Renaissance, at an average price of €240 per day. The liquidation of Exploris in September 2025, after carrying around 1,500 passengers out of approximately 25,000 combined passengers transported by CFC that year, illustrates the risk of this intermediate position: an authentic expedition positioning, but without the financial depth of the luxury segment. History repeats itself: it was already the rise of 3,000-passenger ships that caused mid-market cultural cruising to disappear in the 1990s, with French operator Paquet being acquired as early as 1993.
Rising constraints: geopolitics, overtourism and the energy transition
The sector is approaching the end of the decade with growing uncertainty. These uncertainties are concentrated around three areas, detailed below.
Geopolitical risk
Geopolitical risk materialized financially in 2026 following the war in Iran and the paralysis of the Strait of Hormuz:
- Carnival lowered its full-year forecast from $2.48 to $2.21 per share in response to approximately $500 million in additional fuel costs
- Royal Caribbean lowered its expected growth from 10% to 9%, with a $1.34 billion fuel bill
- Norwegian expects net yield to decline by nearly 5%
Demand nevertheless remains remarkably resilient: Carnival’s 2026 bookings were up 10%, nearly 85% of the year’s departures had already been sold, and customer deposits reached a record level of nearly $8 billion.
Overtourism
Overtourism has led to unprecedented regulation on the French Côte d’Azur. The Nice decree of January 2025 targeted ships carrying more than 900 passengers. Following an intermediate legislative step in July 2025 (a limit of 450 passengers at the Port of Nice, 2,500 at Villefranche, and 65 calls per year, source: France 3 Régions), the prefectural framework that came into force at the end of 2025 set a limit of 3,000 passengers disembarking per call and per port, with an annual average of 2,000 (source: Nice Presse). Cannes has reserved its port for ships carrying fewer than 1,000 passengers since January 1, 2026, with a maximum of 6,000 daily disembarkations (source: 20 Minutes).
The trend is global:
- Venice excluded ships of more than 96,000 tonnes as early as 2015 before banning mega-ships from its city center in 2021
- Amsterdam is promising a total ban by 2035
- Deshaies, Guadeloupe, only allows ships carrying fewer than 500 passengers to anchor.
These thresholds leave the destination-focused segment largely unaffected while constraining the resort segment: regulation is becoming a structural competitive advantage for smaller ships along the most sought-after coastlines.
Environmental considerations
Environmental developments are also gathering pace:
- 61% of the fleet operated by members of the industry association is equipped for shore-side electricity connections (72% expected by 2028)
- 50% of the capacity of new ships will be LNG- or methanol-compatible by 2028 (the aim is to reduce CO2 emissions by 20 to 25%)
- a carbon tax of $100 to $380 per tonne of excess emissions is planned from 2028. Annual revenues are estimated at $10 to $12 billion
You can easily understand that these additional costs will weigh on the accounts of companies in the cruise industry. Ultimately, it will be the customer who pays for them.
2026-2030 outlook: a deliberate divergence rather than convergence
Everything suggests that the dividing line between the two markets (mass-market cruising and luxury cruising) will widen.
For example, almost all the ships under construction or announced for 2026-2030 fall into the high-end category. Here are a few examples gathered from various sources. I invite you to search for some of these names on YouTube. I have included a video above to give you an idea.
- the Corinthian sailing yacht by Orient Express, with 90% sail propulsion
- the Captain Arctic by Selar
- the Amazon Explorer in the Peruvian Amazon
- the Four Seasons One
- the Amangati by Aman
- the Aranoa by Aranui Cruises, heading to the South Pacific in 2027
- the Brasilian Dream by CroisiEurope
The global order book confirms the trend: of the 56 ocean-going ships ordered between 2025 and 2036, worth $56.8 billion, more than 70% are small or medium-sized (source: CLIA).
The “resort” segment (mega-cruise ships) nevertheless remains an important segment from an investment perspective. Carnival has 10 ships on order, while one ship has been ordered for each of the three Norwegian Cruise Line Holdings brands. But this is also the segment that absorbs the greatest impact from what are known as exogenous shocks (fuel costs, port regulations, pressure against overtourism).
I also believe the industrial dimension needs to be addressed. In the years ahead, Europe has a lot to lose. The three European shipyards (Chantiers de l’Atlantique, Fincantieri and Meyer Werft) account for 90% of the global cruise shipbuilding market. This is an attractive niche, and it is obvious that the Chinese are waiting in the wings. Remember China’s weight in the industry:
- 47.3% of ships launched across all categories in 2022
- 49% of the global shipbuilding order book
- first large cruise ship with a capacity of 6,700 passengers delivered to Carnival in 2023
As soon as customers gain confidence in China’s ability to match European expertise, the European monopoly will be over.
In the years ahead, the European shipbuilding industry has a lot to lose to China. The European quasi-monopoly (90%) will be challenged by Chinese shipbuilders.

FAQ: Your questions answered
Who is the global leader in the cruise market?
Carnival Corporation is the world’s leading cruise group, with record revenue of $26.6 billion for fiscal year 2025 and brands including Carnival Cruise Line, Costa Cruises, Princess Cruises, Holland America Line, Seabourn and Aida. Royal Caribbean Group (Royal Caribbean International, Celebrity Cruises, Silversea) is the world’s second-largest player, with nearly $18 billion in revenue and a record 9.4 million passengers in 2025 (source: Yahoo Finance). In terms of capacity, Royal Caribbean International is the leading brand with 114,417 berths at the end of 2026, ahead of Carnival Cruise Lines (94,402), MSC Cruises (88,394) and Norwegian Cruise Line (63,798). Norwegian Cruise Line Holdings (NCL, Oceania Cruises, Regent Seven Seas) completes the leading group with $9.8 billion in revenue in 2025 (source: Seeking Alpha).
How many passengers does the global cruise market represent?
37.2 million passengers took an ocean cruise in 2025, an increase of 7.5% year-on-year and a third consecutive annual record. North America dominates with 22.1 million passengers, ahead of Europe (8.9 million) and Asia (3 million), with the United States alone accounting for 55% of the global market. Industry forecasts point to 38.3 million passengers in 2026 and 42.1 million in 2029, compared with just 1.9 million in 1985.
What is the economic impact of the cruise industry?
The global economic impact of the sector reached a record $168 billion in 2023, supporting 1.6 million jobs (77% of them on land), contributing $85.6 billion to global GDP and generating $56.9 billion in wages, while cruising accounts for only 2% of global tourism (source: CLIA). In Europe, the economic contribution reached €64.1 billion in 2024, supporting 445,000 jobs (source: CLIA Europe 2024 report). In France, the impact amounted to €6.35 billion in 2024, including €2.6 billion in GDP contribution, supporting 28,300 jobs and generating €1.55 billion in wages, with shipbuilding alone accounting for €2 billion.
Why are cruise ships getting bigger and bigger?
Mega-ships are the result of an economic logic theorized by industry executives as early as 2014: larger ships reduce operating costs per passenger and make it possible to offer introductory prices of around $100 per night, while maximizing onboard spending, which accounts for approximately 30% of the revenue of major groups, with occupancy rates structurally exceeding 100%. Royal Caribbean’s Icon of the Seas (7,600 passengers, $1.5 billion) is the ultimate expression of this trend. However, the trend is partially reversing: port regulations (limits ranging from 450 to 1,300 passengers on the French Riviera, and 1,000 passengers in Cannes since 2026) are now constraining mega-ships, while more than 70% of the 56 ships ordered between 2025 and 2036 are small or medium-sized.
Which segments offer the strongest growth potential in the cruise market?
Two segments are driving growth in value. **Luxury comes first:** the number of passengers rose from 114,000 in 2020 to 1.207 million in 2025, more than a tenfold increase, with ultra-luxury capacity having tripled since 2010 and four hotel brands entering the market in four years (Ritz-Carlton Yacht Collection, Four Seasons, Orient Express, and Aman). **Expedition cruising** comes next: passenger numbers increased by 22% in 2024, while global capacity is expected to more than double by 2029. Premium river cruising, represented by Viking (86% of its 2026 capacity sold by mid-February 2026), is the third growth driver. If you are a sector player looking to understand your customers’ expectations in these segments, our team can conduct a tailored B2C market research study to meet your needs.
What are the prospects for the cruise market through 2029?
Industry forecasts point to 38.3 million passengers in 2026 and 42.1 million in 2029. **Volume growth will continue to be driven by the large-ship segment**, where demand remains resilient (nearly 85% of Carnival’s 2026 departures already sold, with customer deposits reaching a record level of almost $8 billion), while **value growth will come from destination-led segments:** luxury, expedition, and river cruising, as illustrated by Celebrity Cruises’ entry into European river cruising in 2027. The main uncertainties concern fuel costs, carbon taxation ($100 to $380 per tonne from 2028 under the International Maritime Organization framework), increasing regulatory pressure in congested ports of call, and the viability of the mid-market segment. For an in-depth analysis of this market tailored to your business, our B2B market research firm can support you.


![Illustration of our post "Digitization: food & beverage industry companies lag far behind [Research]"](/blog/app/uploads/marche-alimentation-bio-long-120x90.jpg)


![Illustration of our post "Remote work: are employees cheating? [Survey]"](/blog/app/uploads/telework3-120x120.png)