Research into charging prices for electric vehicles via the Chargemap platform reveals incomprehensible differences between operators and countries. Differences of 1 to 9 are highlighted, as well as billing models that make driving in electric mode unprofitable in 32.6% of cases compared to gasoline.
Our exclusive research on the price of electric vehicle recharging on the Chargemap network in 20 European countries reveals incomprehensible pricing differences. These differences reflect the lack of regulation in a sector that, in some countries, takes advantage of an oligopolistic situation to impose excessively high prices on consumers. This situation also raises questions about Chargemap’s margins and the necessary evolution of a sector that suffers from inefficiencies (competition and price transparency) on which operators and intermediaries thrive.
Contact IntoTheMinds research agency
Statistics on the price of electrical recharging in Europe via Chargemap
- 68.8% of recharges are billed by kWh only
- 21.4% of recharges are billed per kWh and minute
- 6.3% of recharges are billed by the minute only
- In 5.2% of cases, fixed costs are added, up to €14.52 per charge.
- Among the operators billed by kWh on Chargemap, the cheapest is EVBox in Norway (€0.2/kWh), and the most expensive is Saascharge International (€1.391/kWh). Chargemap’s margin on Saascharge’s tariff is 58%.
- The cheapest charge is in Norway (€10.1 for 48.6kWh).
- The most expensive recharging is in Argeles-sur-Mer, France (charged by time only: €0.872/minute for a 3.7kW domestic socket and a 22kW Type 2).
By way of introduction, it should be remembered (see also methodology section) that the figures quoted in this article come from a survey carried out in August 2023 on Chargemap. The quoted prices do not reflect the prices you could obtain by taking out a subscription directly with an operator. But that’s not the point. Apart from the fact that a subscription (for a fee) binds you to a given operator, this is no solution for the electric car owner traveling outside their country’s borders.
Objectives of this article
The aim of this article is twofold.
On the one hand, as an electric vehicle owner, I would like to understand the price differences that exist from one operator to another. It seemed illogical to me at first that prices should vary too widely because electricity is a commodity. Would it make sense for a liter of petrol to be priced at €2 a liter in one station and €14 in another, let alone in the same country?
On the other hand, I wanted to ask myself, through these price differences, about the efficiency of the market and its possible future. The market could be more cohesive and efficient in the current absence of regulation. Intermediaries (like Chargemap) thrive on these inefficiencies to the detriment of consumers. What are the solutions, and what does the future hold for Chargemap and its equivalents?
But before jumping to any hasty conclusions, let’s look at the figures.
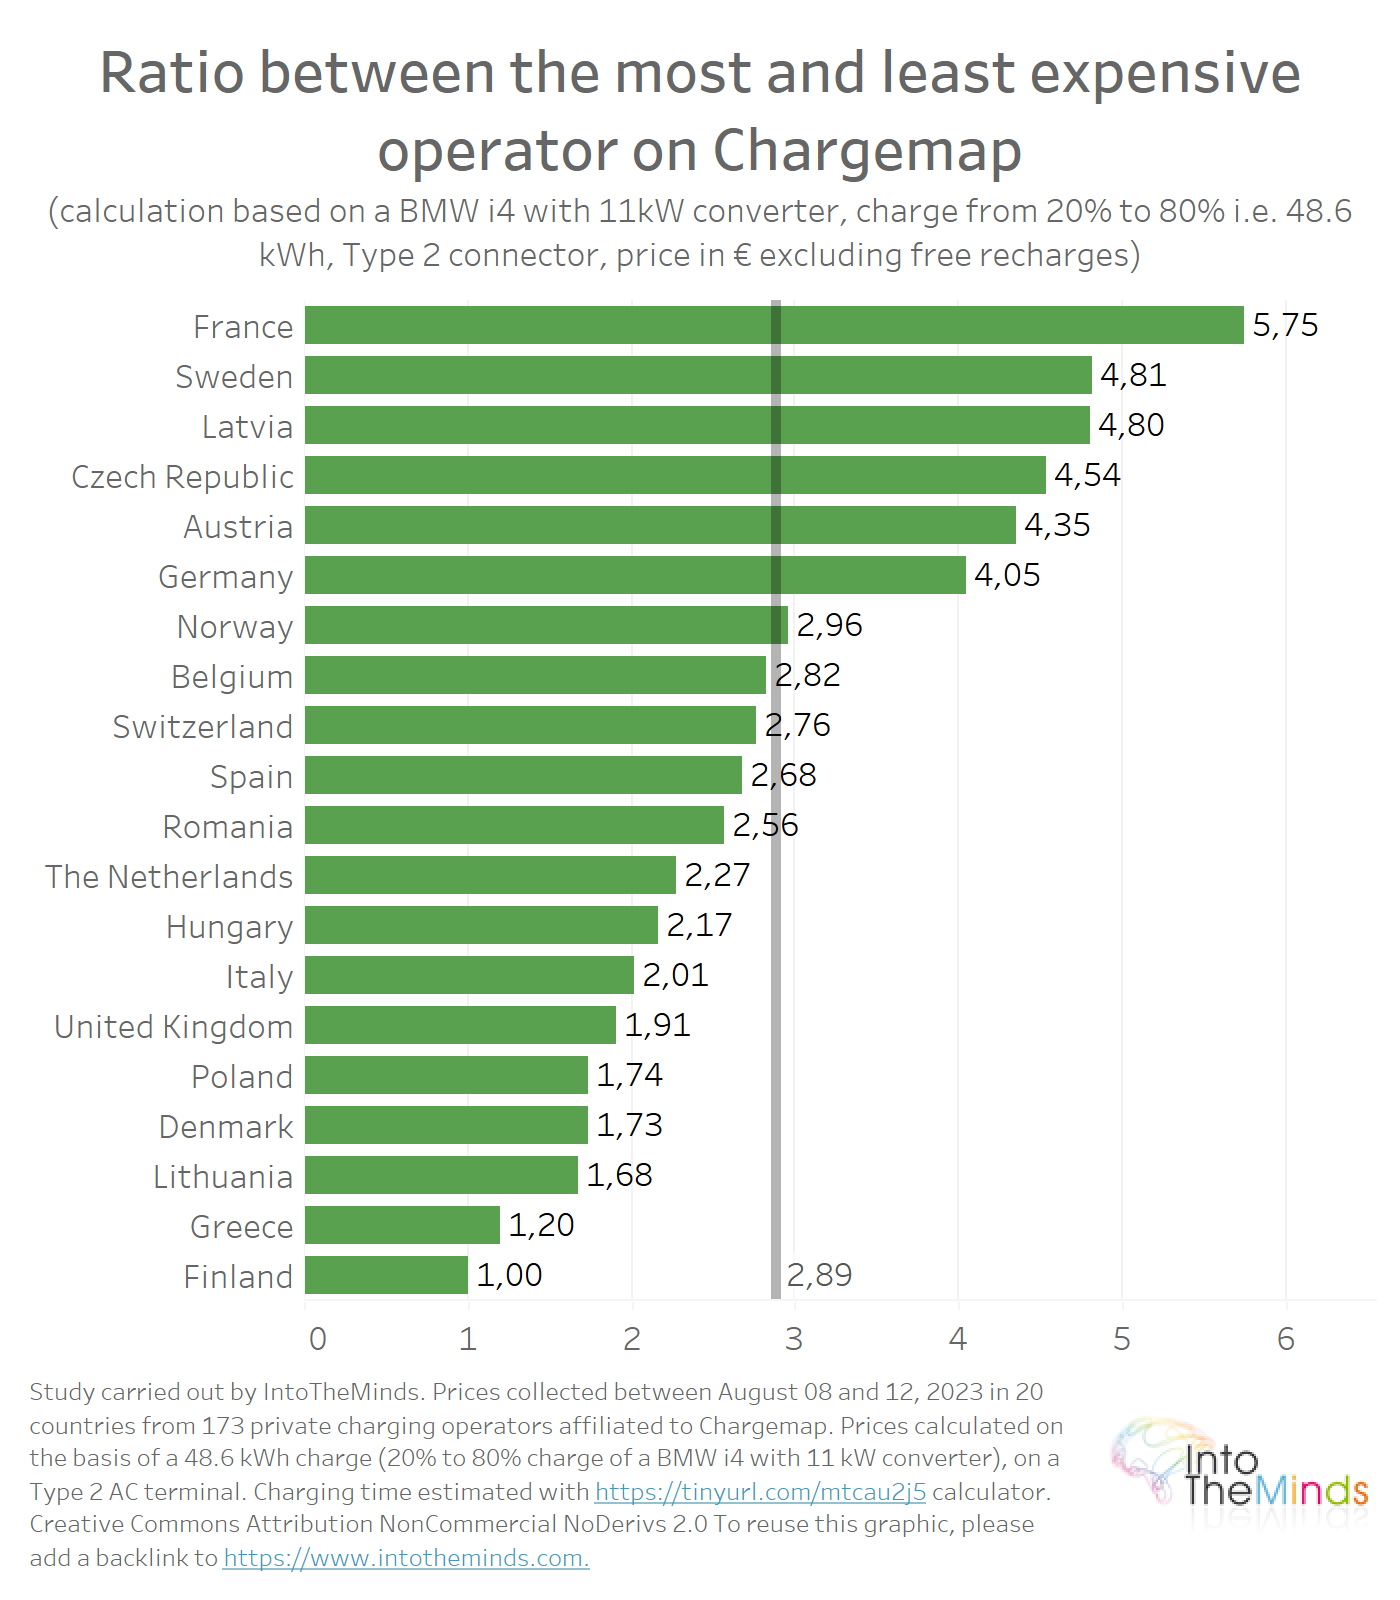
Prices vary by a factor of three in the same country
Within a single country, prices generally vary by a factor of three. The average price difference between the most and least expensive operators is 2.89. In some countries, the difference between the cheapest and most expensive kWh can be even greater:
- 5.75 in France
- 4.81 in Austria
- 4.80 in Latvia
Apart from these extremes, the differences remain striking in most countries, so much so that they beg the question of their origin. Why would we see differences of 1 to 3 for a commodity like electricity in the same country?
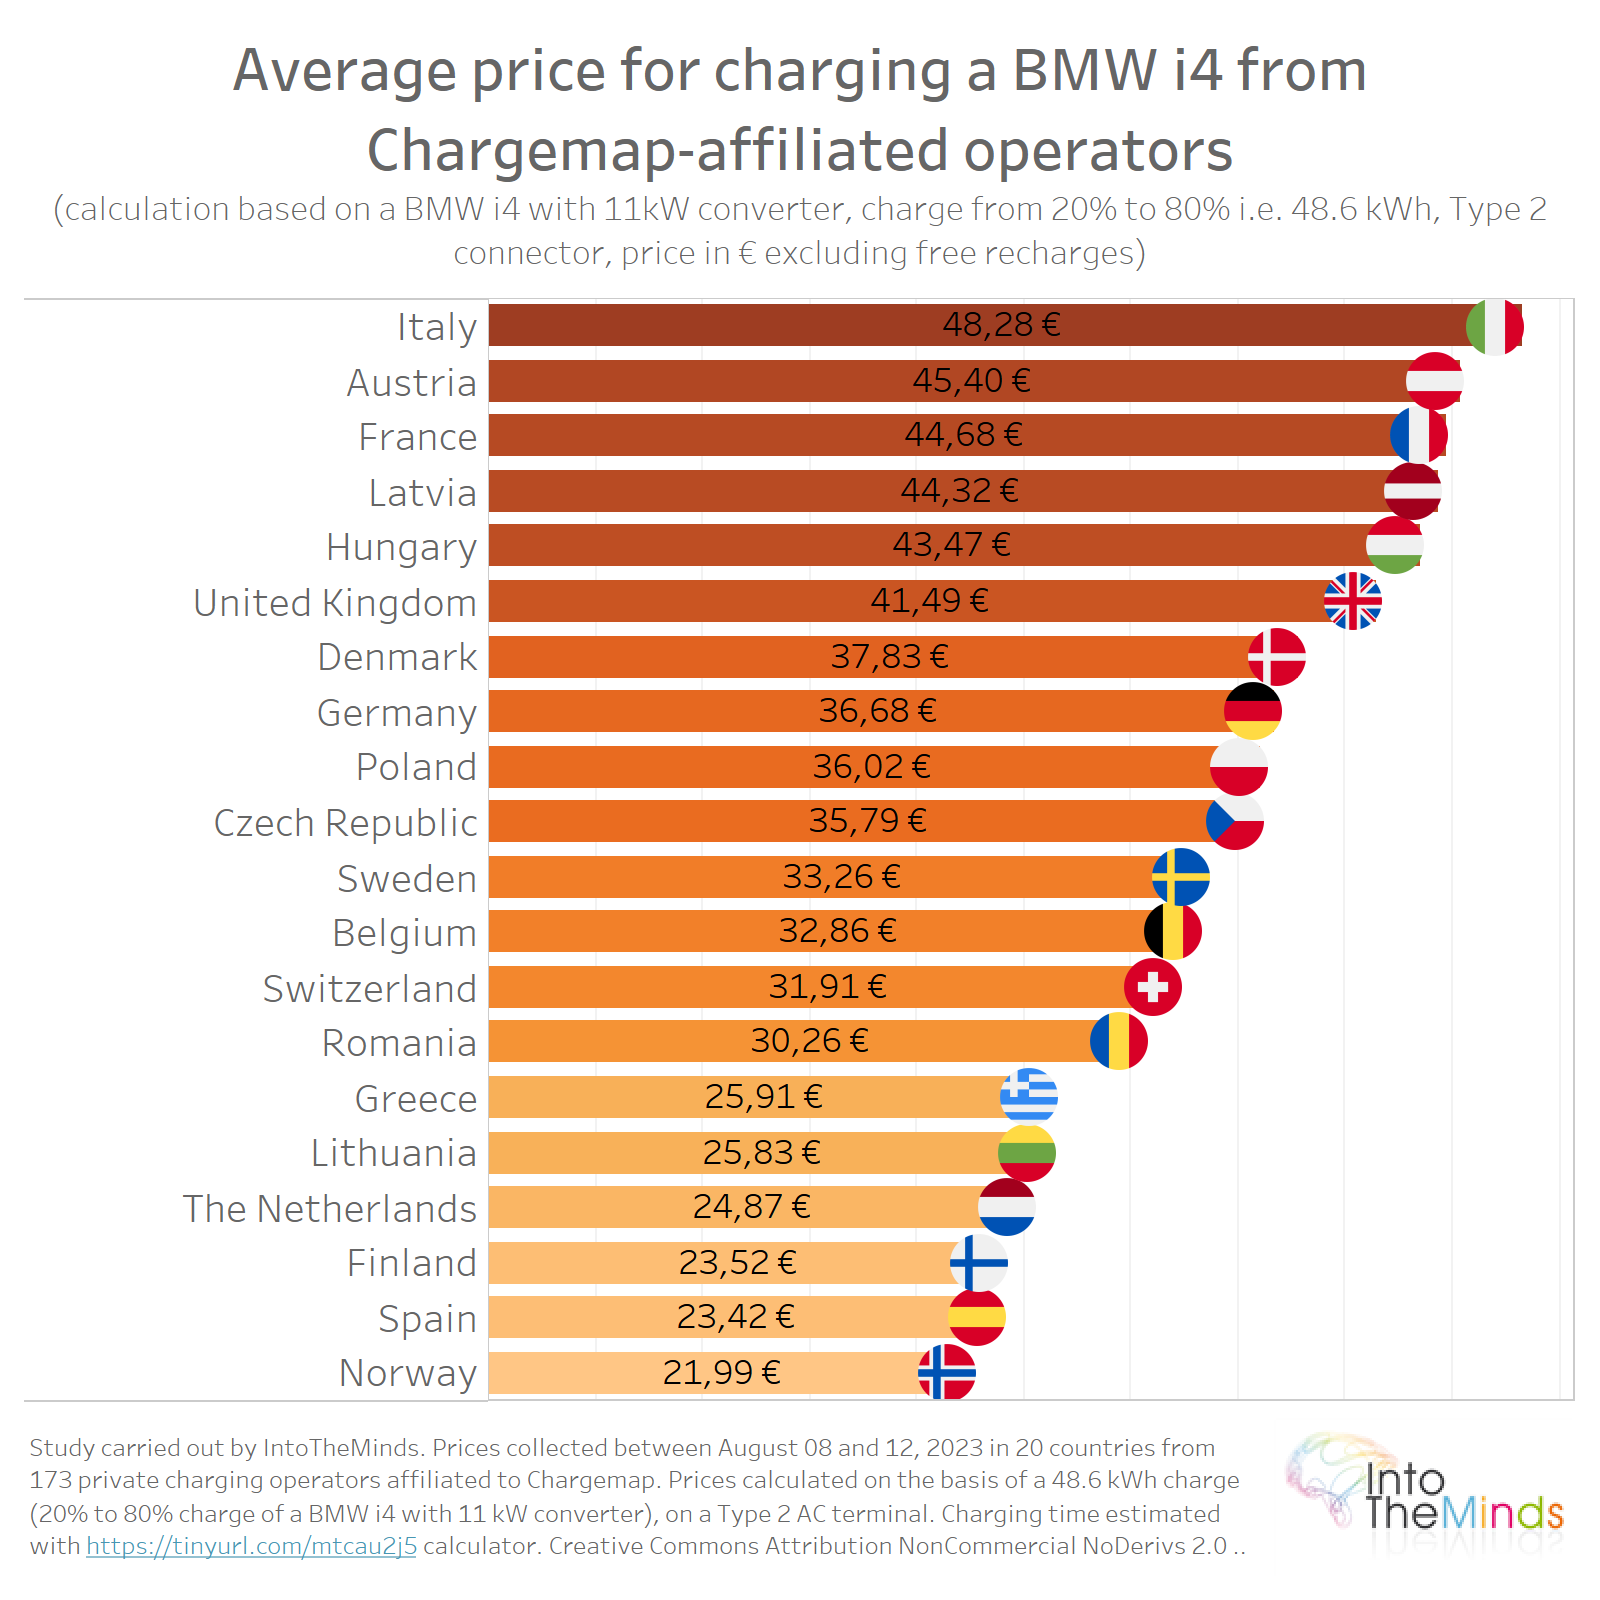
The most expensive recharge is in Italy
The average recharge price can vary by as much as double, depending on the country. While you’ll pay €21.99 in Norway, it will cost you €48.28 in Italy.
These differences are even more impressive when each of the prices is represented. In the graph below, each blue dot represents an operator. The orange dot represents the median top-up price for the country in question. The price differences are difficult to explain for rational reasons.
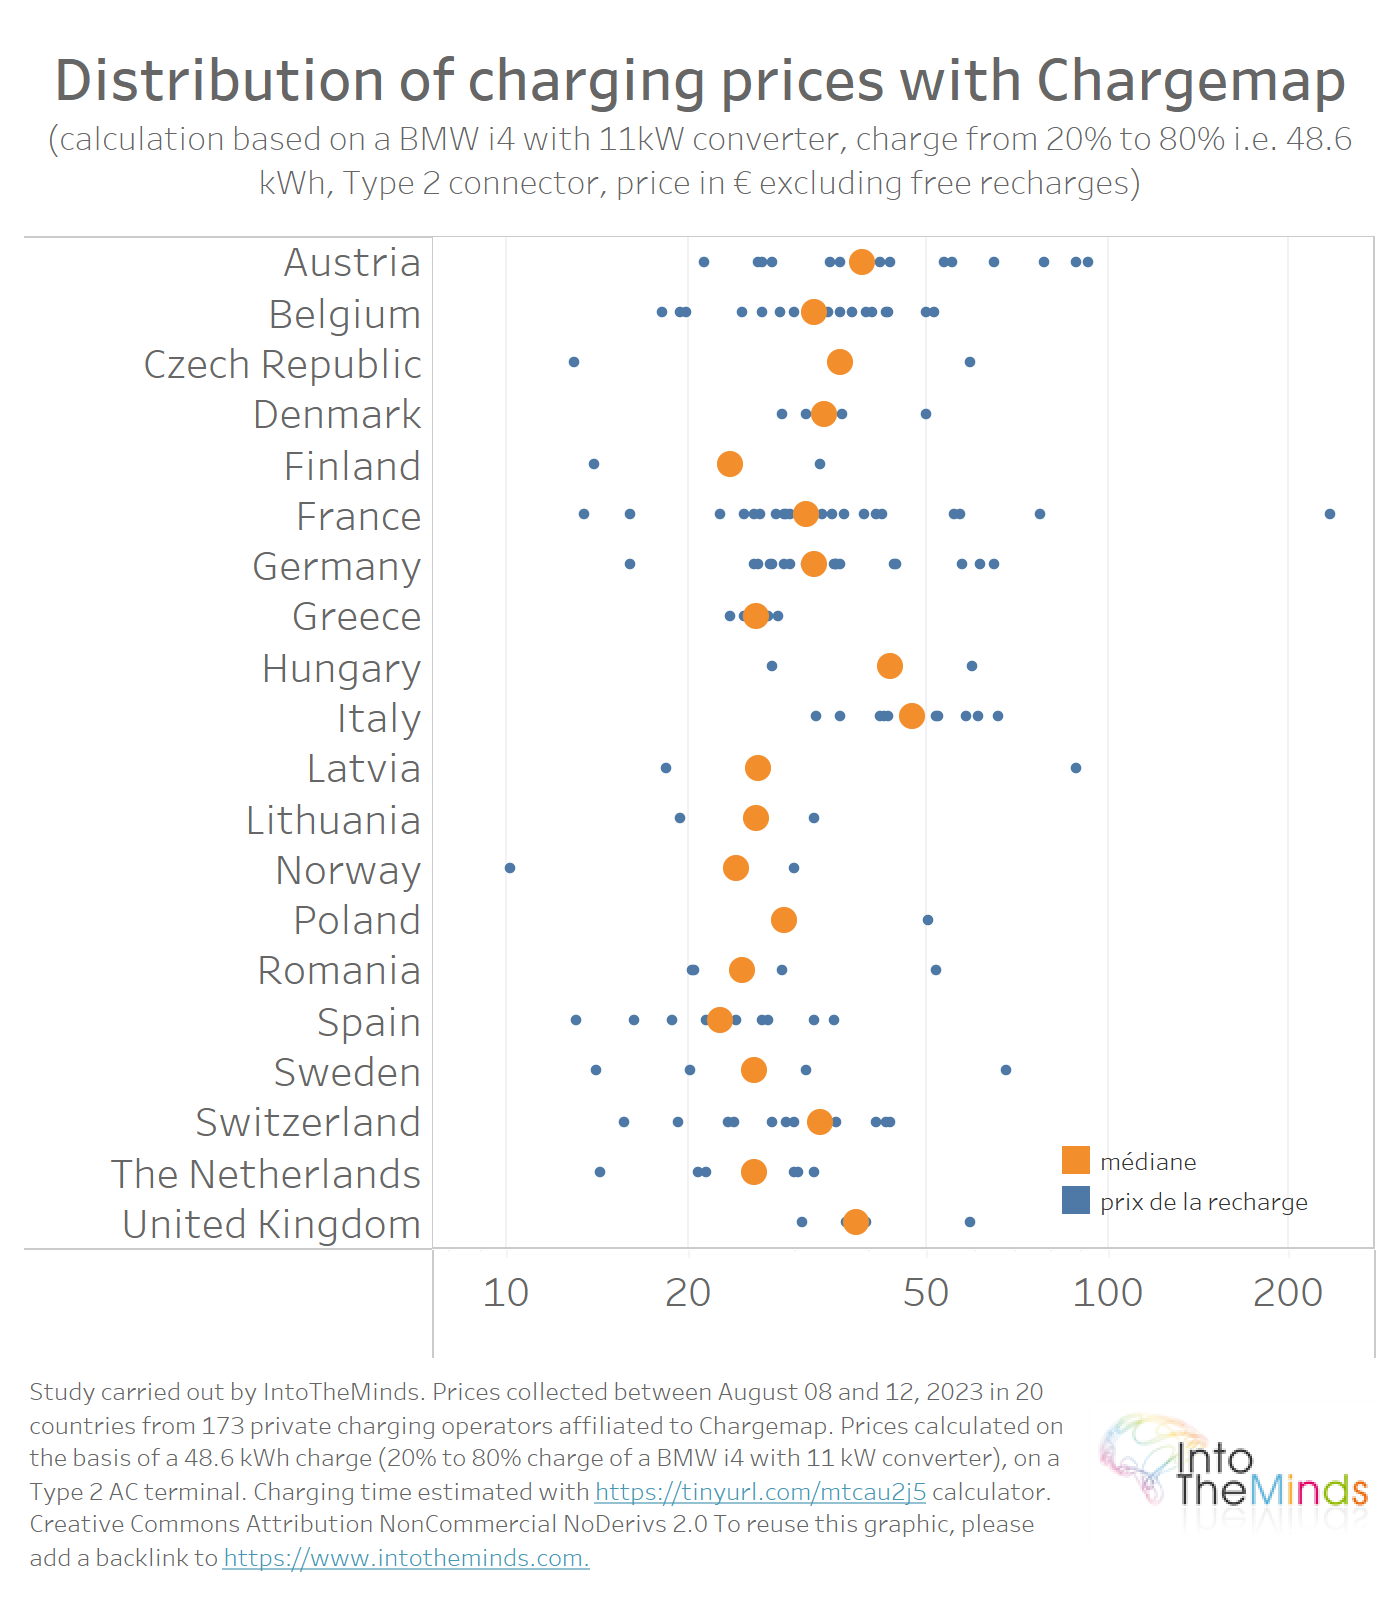
This raises the question of the profitability of driving electric (with a Chargemap card).
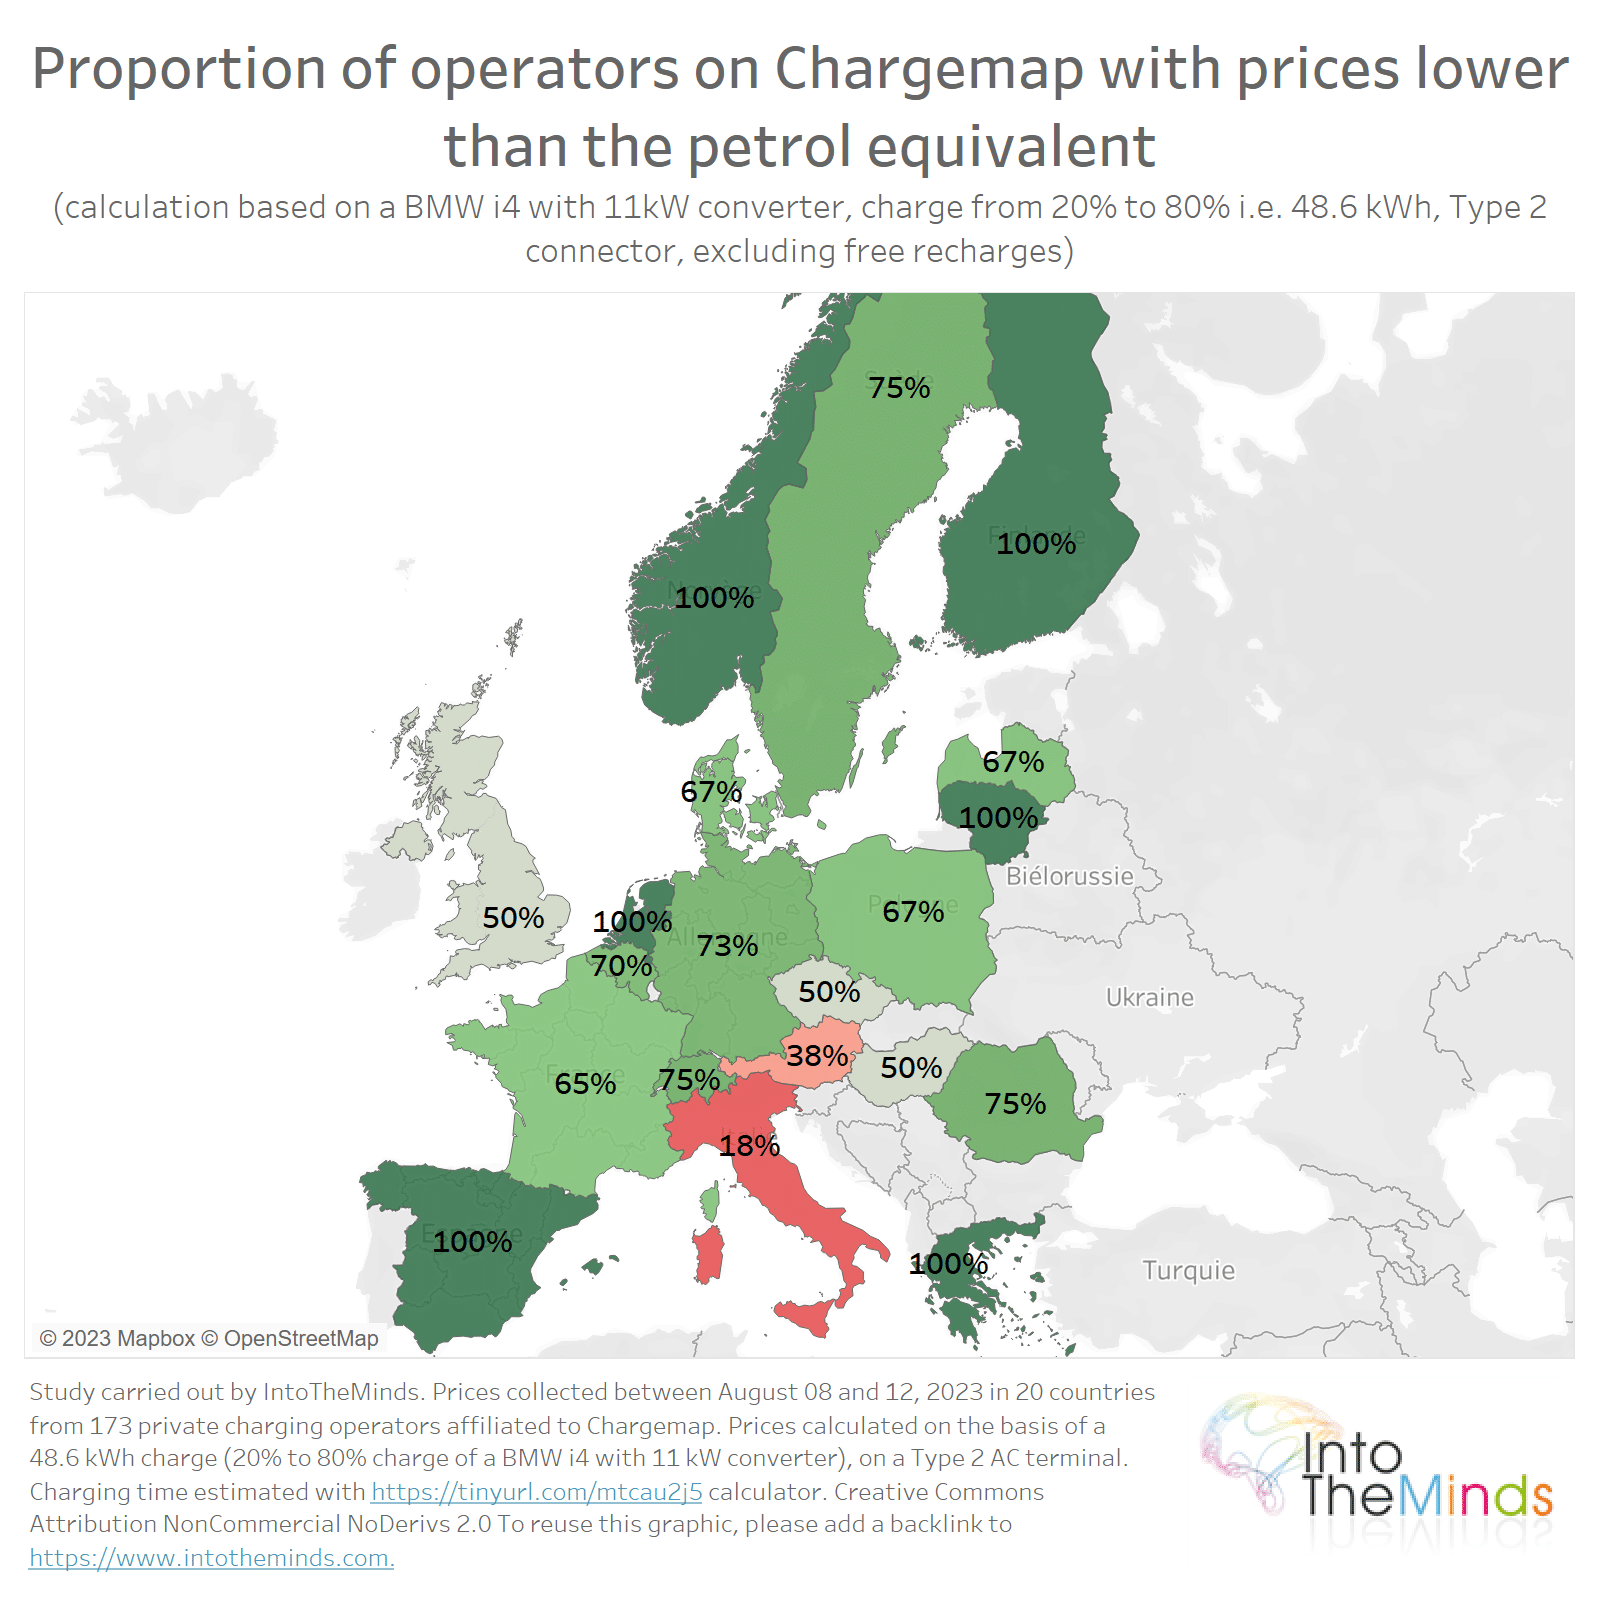
This research shows that, at the European level, 67.4% of operators on Chargemap have prices that are still more attractive than petrol. But this situation varies greatly from country to country. In Italy, for example, 82% of operators on Chargemap are billed to the end customer at prices that make electric driving more expensive than petrol. So, for Italian owners who can’t recharge at home, driving on petrol is still more profitable (unless you take out a subscription directly with one or more operators).
On the other hand, in other countries, running on electricity is still cheaper than running on petrol. This is the case in Greece, Spain, Norway, Lithuania, the Netherlands and Finland.
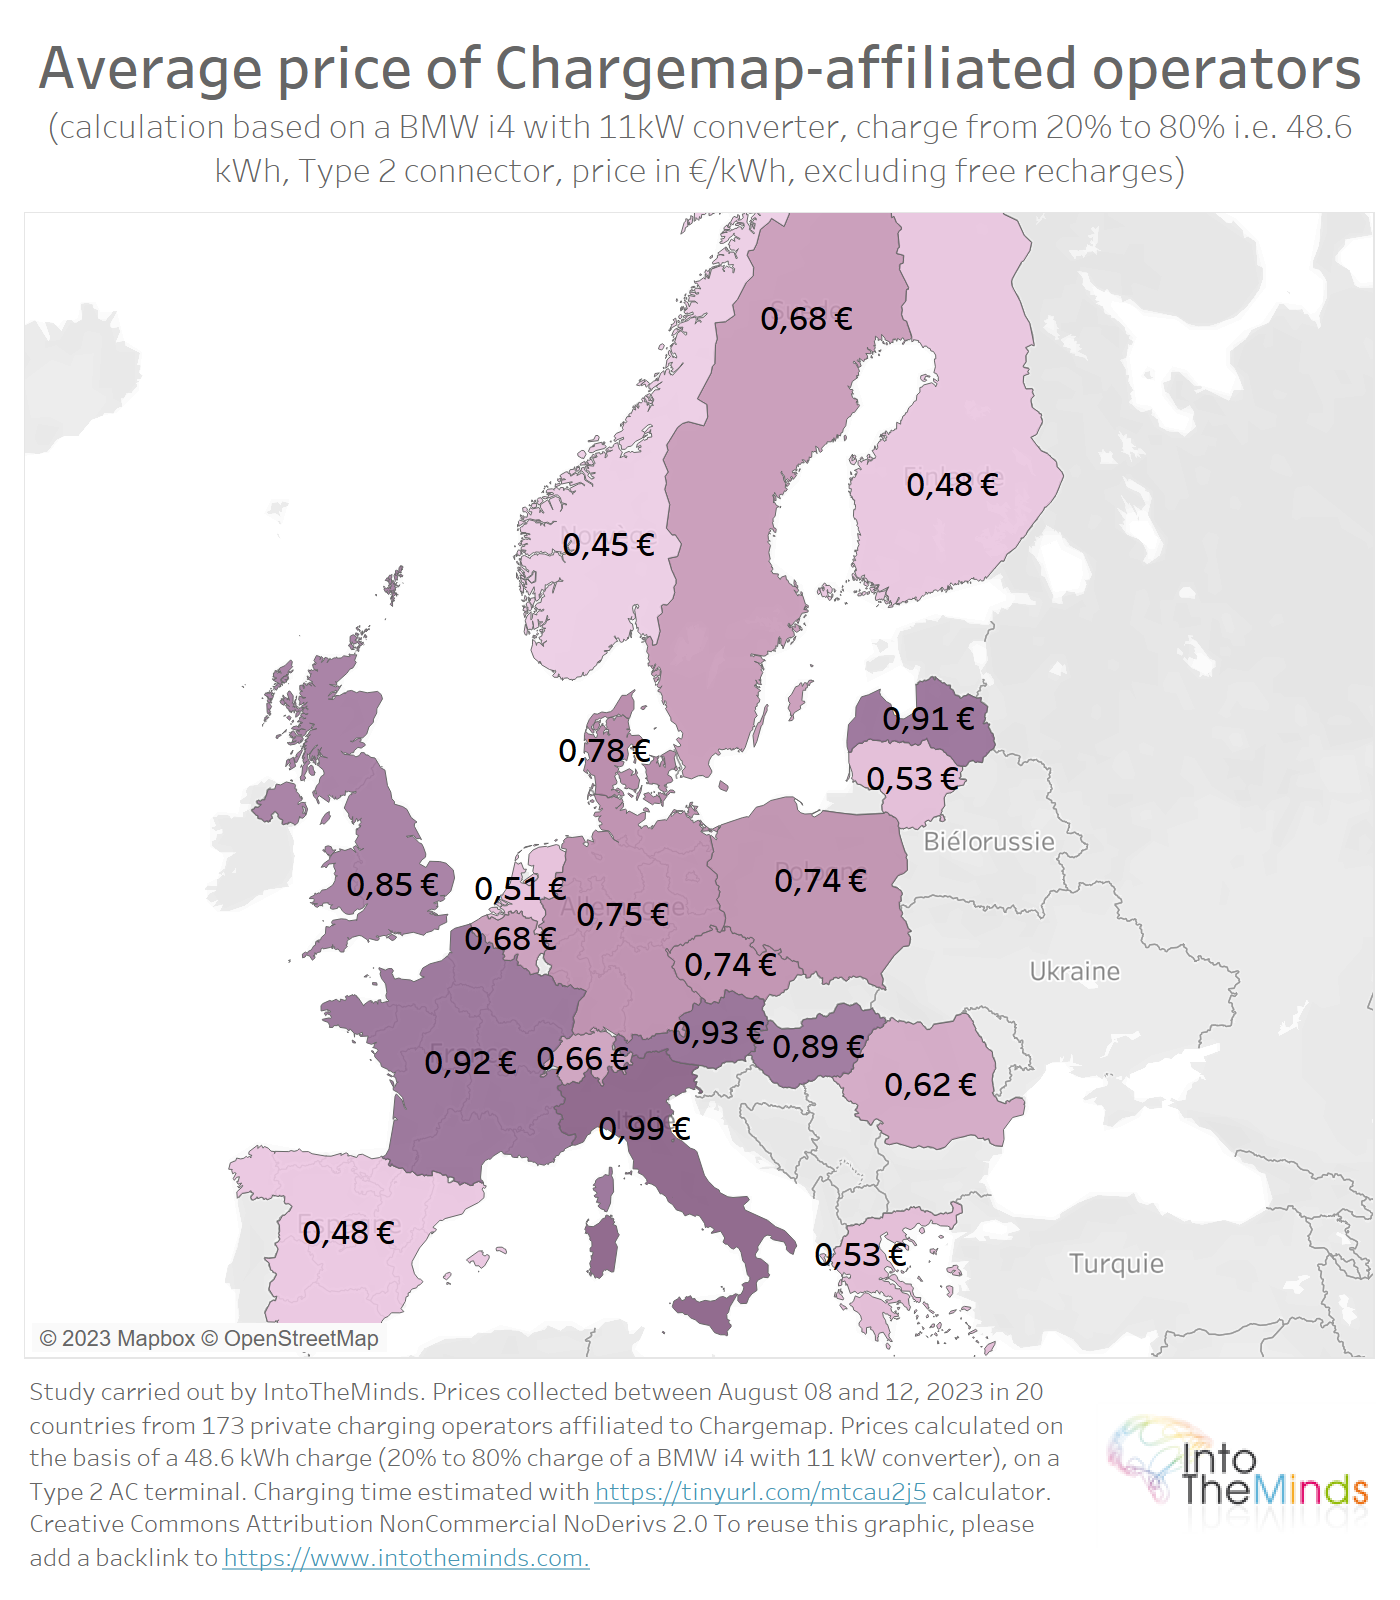
The cheapest kWh is in Norway with Chargemap
Based on a charge of 48.6 kWh, it is possible to calculate an average price per kWh. There are plenty of surprises. In the trio of the most expensive countries on Chargemap, we find Italy, Austria, and France, with prices per kWh close to €1. The causes are undoubtedly different.
Italy’s first place is unsurprising, as it is Europe’s second most expensive country for industrial electricity prices, with €0.3257/kWh in the second half of 2022 (see Eurostat statistics). But what about France and Austria? Austria is one of the 10 cheapest countries in Europe (e0.1717/kWh), and France, thanks to its nuclear fleet, supplies almost the cheapest electricity in Europe (€0.1237/kWh). Only Finland does even better, with an industrial price of €0.1144/kWh.
What’s going on?
In Austria, high prices are largely due to the pricing model. Of the 21 Austrian operators listed on Chargemap:
- 5 charge per minute in addition to per kWh
- 8 charge only based on charging time.
This is all the more disadvantageous as these are not supercharging stations but 11 or 22-kW stations. If your car doesn’t have a powerful converter, your charge takes longer, and you’re penalized. Electromaps in Ried im Innkreis is the winner, whose services via Chargemap for an 11kW charging point cost €0.29/min plus a fixed charge of €14.52.
An oligopolistic situation is bound to be sub-optimal. Intermediaries like Chargemap jump into the breach because it represents a business opportunity.
Chargemap takes advantage of market inefficiencies
What can we learn from this research, and what does it tell us about the state of the market for charging electric vehicles at public charging stations?
Lesson 1: Price variations
The first lesson is that prices for a commodity vary widely. While industrial electricity prices vary from 1 to 3 between Finland (the cheapest) and Romania (the most expensive), Chargemap charging prices vary from 1 to 9 and even from 1 to 23 when outliers are considered.
Lesson 2: Chargemap’s services are far from free
The second lesson is that Chargemap services are not free and sometimes expensive. In the case of Europe’s most expensive charging station on Chargemap, we know that the price of Saascharge has more than doubled. A margin of 58% is shared between Chargemap and the interoperability platform. Regular Chargemap users should, therefore, ask themselves how profitable the operation is. For those who travel little, taking out a subscription directly with an operator might be more attractive.
Lesson 3: the market
The third and final lesson concerns market structure. By imposing sometimes complex subscriptions and tariffs, operators try to lock users into their network. The method is well known and has made Apple’s day, for example, with its charging cables, system of operations, application store, etc.
Added to this is the structure resulting from the public markets, which order the installation of self-service kiosks. By necessity, these public markets are dominated by a few companies, leading to oligopolistic situations in some cities. An oligopolistic situation is bound to be sub-optimal. Intermediaries like Chargemap jump into this breach because it represents a business opportunity. Clear rules, imposed at the European level to simplify competition, should bring flexibility to this market. For example, making it more flexible to use terminals belonging to different operators without a subscription card is essential. At a time when everyone has learned to pay with their bank card and without contact, it is urgent to make kiosks compatible with each other. In this way, companies like Chargemap should eventually disappear.
Methodology
For this research, we surveyed the prices of 173 operators on Chargemap for recharges on Type 2 AC (the most widespread) charging stations from 3 to 44 kW. The survey was carried out in 20 European countries.
The price recorded was that charged by Chargemap to make reliable comparisons between operators, Europe’s most extensive charging network for electric vehicles.
The cost of a charge was calculated based on a 20% to 80% charge for a BMW i4, i.e., a charge of 48.6 kWh. This vehicle is equipped with an 11kW converter. The charging time was determined using this online calculator.
Average power consumption was calculated based on manufacturer data, i.e., 17.6 kWh/100 km (official WLTP cycle data: 16.1-19.1 kWh/100). The average fuel consumption of a combustion-powered vehicle was determined based on Ademe‘s 2020 data for the French fleet, i.e., 6.8L of petrol per 100 km. The price of a liter of gasoline was set at 2€/L in this research to overestimate the price per kilometer of a combustion-powered vehicle.


![Illustration of our post "Remote work: are employees cheating? [Survey]"](/blog/app/uploads/telework3-120x120.png)