Since its launch, the Nutri-score has generated extensive debate, and the recent revision of its calculation method has not helped. The Nutri-score rates the nutritional quality of foods from A to E, and it divides as much as it attracts. But beyond the controversies, this article focuses on a central question: does this nutritional labeling system वास्तवmente change our consumption habits? We have conducted numerous surveys on the subject in different countries, and the results deserve to be nuanced in light of market data. That is what I propose to do in this article, with the added bonus of an infographic I created using the most recent data I could collect.
Contact the IntoTheMinds research institute
Key takeaways
- The Nutri-score effectively influences 33% of French consumers in their purchasing decisions according to 2024 data
- Its effectiveness largely depends on visibility: only 33% of food products displayed it in 2024
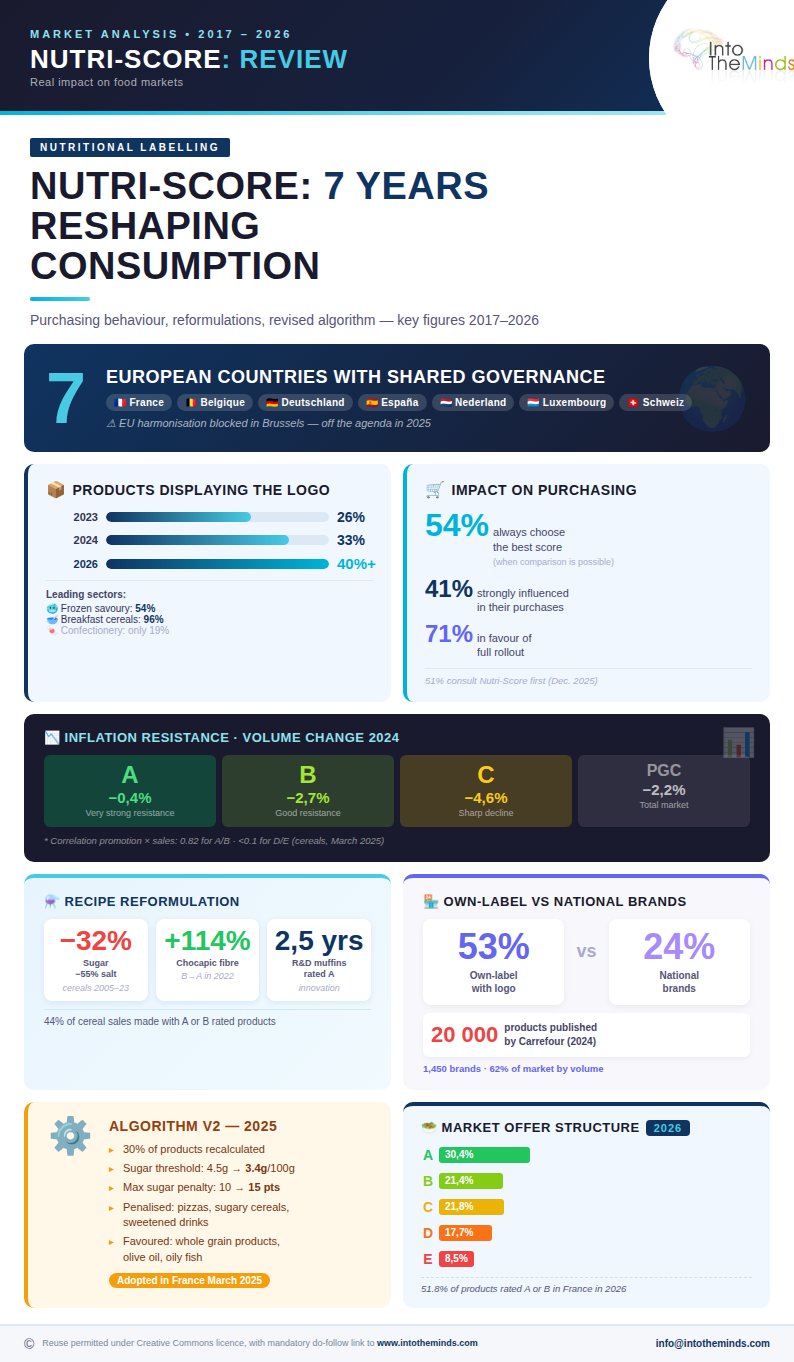
- Products rated A are more resilient in crises (-0.4% vs -4.6% for C-rated products in 2024)
- Retailers play a key role: 53% of private-label products display the logo vs 24% of national brands
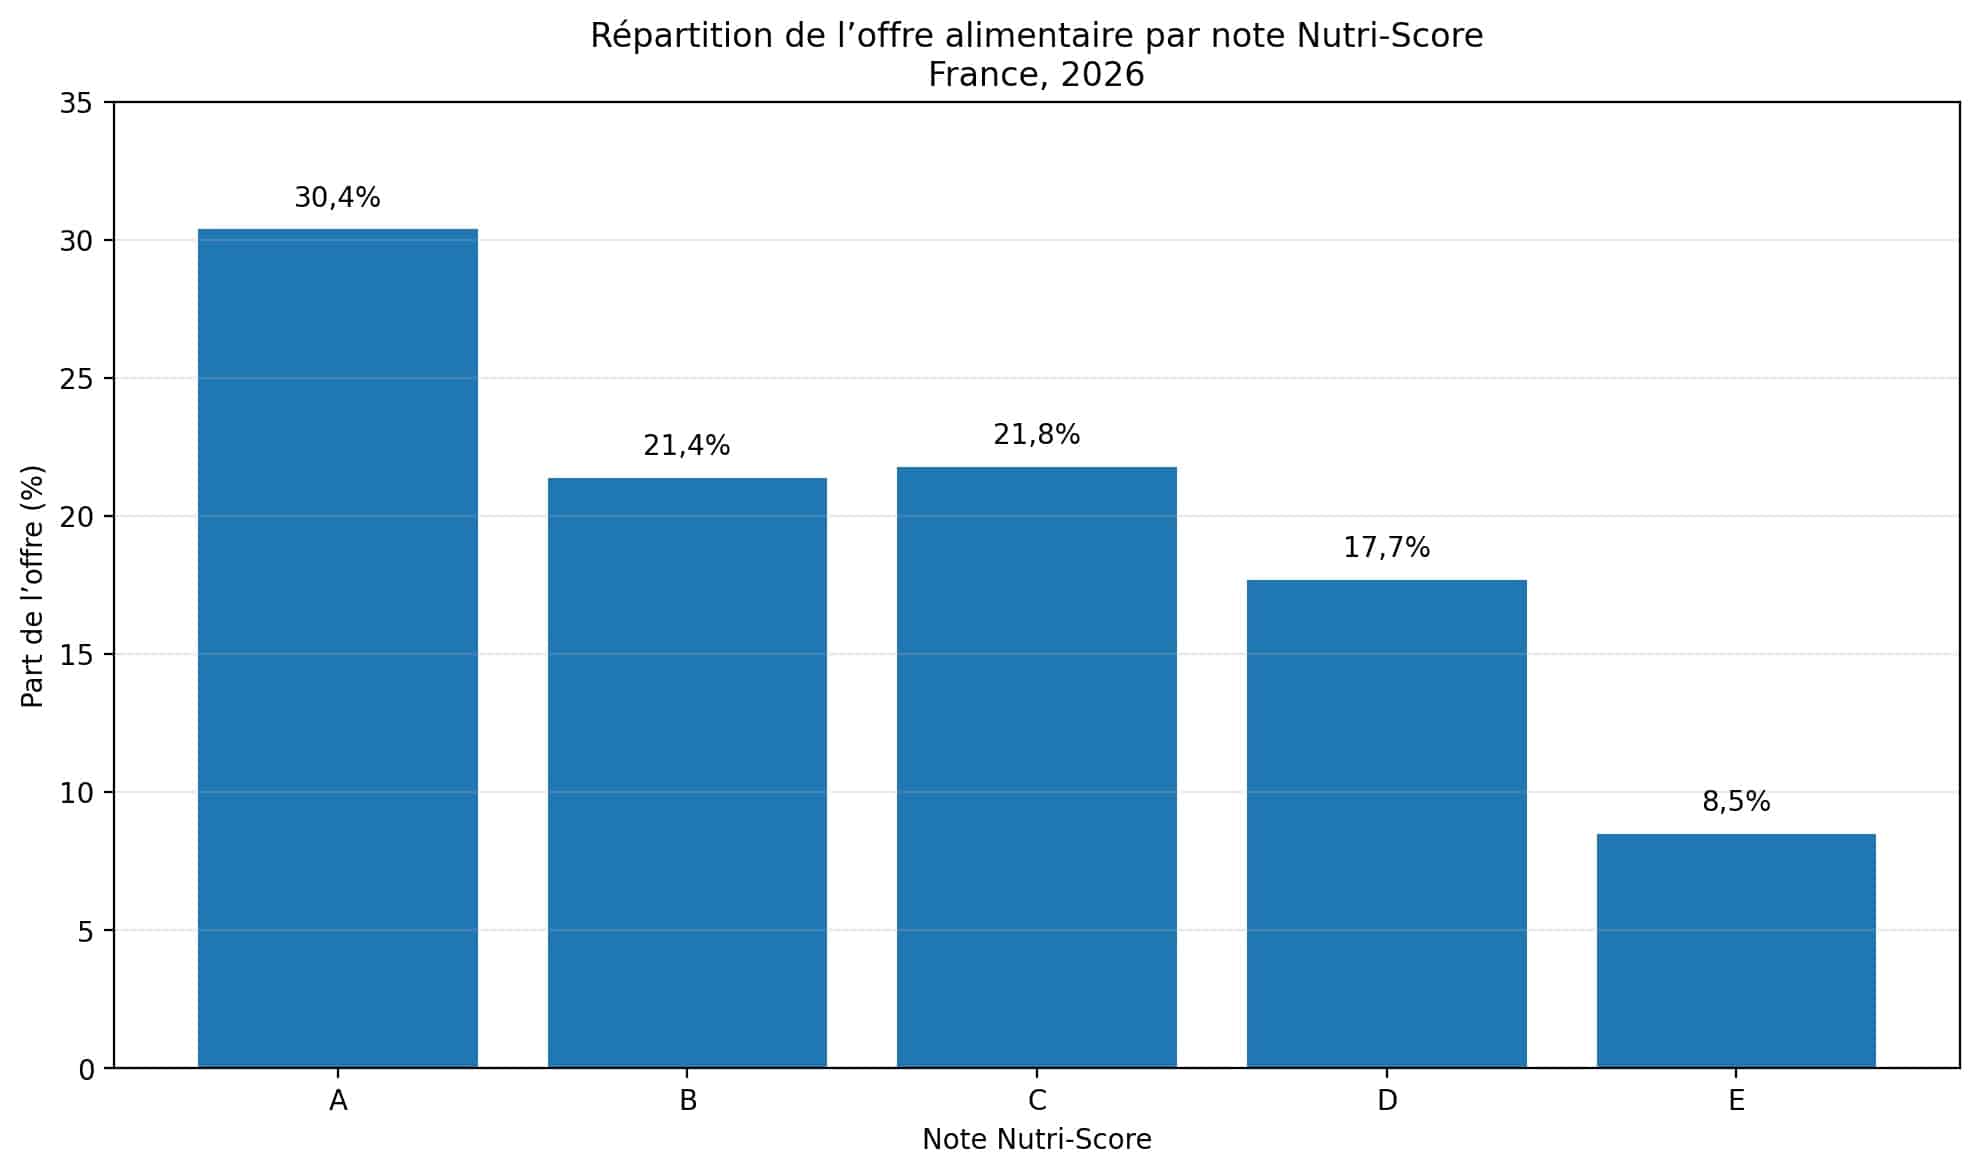
- The revised 2025 algorithm tightens criteria, especially for sugary products
- 1450: number of brands engaged in Nutri-score in France in March 2025 vs 1400 a year earlier
- 62%: food market share (by volume) under Nutri-score in France in 2024–2025
- 54%: share of French consumers declaring in March 2026 that they always buy the product with the best Nutri-score when they have a choice (+0.3 point)
- 71%: share of French consumers in favor of generalizing Nutri-score to all food products in March 2026
- 51%: share of consumers primarily consulting Nutri-score to guide purchases in France in December 2025
- 32%: average price gap observed between cereals rated A or B and those rated D or E in March 2025
The Nutri-score project: current state
Partial European adoption
The history of Nutri-score extends far beyond French borders. As early as August 2018, Belgium adopted this nutritional label as a reference to guide consumer choices. The idea is that Nutri-score acts as a “nudge” among others (see also this article on the role of algorithms in food choices). At that time, Delhaize announced it would cover all 771 stores within two years, while Colruyt aimed for full deployment by mid-2020. This Belgian momentum was supported by 70 local companies.
In October 2018, Danone took the step of applying the system to all its dairy products sold in Belgium. More than 70% of its references received A or B ratings, before gradual generalization until the end of 2020. This early adoption by a major food company marked a turning point in the system’s credibility.
Today, the transnational governance of Nutri-score brings together 7 European countries: France, Belgium, Germany, Spain, the Netherlands, Luxembourg, and Switzerland. However, European harmonization remains blocked in Brussels. In March 2025, expanding the voluntary system to the rest of the European Union is no longer on the European Commission’s agenda. Nutri-score is therefore progressing through partial diffusion rather than continental unification.
From simple labeling to a reference standard
Over time, Nutri-score has gone beyond its initial role of nutritional information. It has become a simple and understandable comparison benchmark, to the point of inspiring other scoring systems. In 2023, several DIY, furniture, and e-commerce retailers launched environmental scores explicitly designed “based on the Nutri-score principle,” using A-to-E ratings.
This recognition is based on simplicity. In October 2022, the system was known by 90% of French consumers. In March 2026, a market study indicates that nearly two-thirds of French people say they are familiar with it, with awareness increasing by 49 points in six years. This apparent paradox is due to differing methodologies across studies, but the underlying trend is clear: between 2018 and 2026, Nutri-score moved from regulatory innovation to a familiar reference in purchasing decisions.
| Period | Awareness in France | Change | Source |
|---|---|---|---|
| October 2022 | 90% | – | Reference study |
| March 2026 | 67% | +49 points vs 2020 | Market study |
Gradual but uneven presence on products
The impact of Nutri-score depends primarily on its actual presence on packaging. This presence is increasing, but slowly. In July 2023, just over one in four food products displayed the logo (26%), up by 2 points. In 2024, this share reached 33% of food products (+7 points vs 2023). By March 2026, it exceeded 4 out of 10 products.
Distribution remains highly uneven across categories. In 2023, on-pack Nutri-score reached 54% in frozen savory foods, 29% in frozen sweet products, and only 16% in non-alcoholic beverages. In sweet grocery products, barely one in five displayed it in May 2023, compared to one quarter overall. Some categories are far ahead: in 2022, 96% of breakfast cereal volumes sold in France carried Nutri-score, compared to only 19% of confectionery.
Growth is largely driven by retailers. In 2024, 53% of private-label products displayed Nutri-score vs 24% of national brands. Retailers are acting as a driving force. This proactive stance is reflected in strategies: as early as 2024, Carrefour threatened to calculate scores itself for products not displaying them, eventually publishing Nutri-scores for 20,000 national-brand products.
What is the impact of Nutri-score?
Influence on purchasing behavior
Data converges toward one conclusion: Nutri-score does influence consumer choices. As early as September 2023, it was established that the system guides choices and that better-rated products gain positions without specific supply-side support. However, a 2024 study analyzing 180 scientific publications showed that many favorable studies were authored by Nutri-score creators. The authors found that 61% of independent studies showed no influence. Another study of 72 articles showed more positive results, while a meta-analysis identified only 2 studies with declared conflicts of interest.
As always, the truth is nuanced. There is no perfectly rational consumer (“homo economicus” does not exist), and Nutri-score’s influence depends on multiple factors. A 2025 study showed that its impact depends on consumers’ health expectations. Based on declarative data, 33% of French consumers in 2024 said they had been influenced by Nutri-score.
Sales data provides additional insight. In July 2023, a market study showed that higher ratings, especially B, outperform C or D. In categories like ham or pizza, the best-rated products sell the most.
In 2024, an interesting phenomenon emerged: while overall FMCG volumes declined by 2.2%, A-rated products declined only by 0.4%, compared to -2.7% for B and -4.6% for C. Nutri-score does not determine sales alone, but acts as a resilience factor during inflation.
In March 2025, analysis of the cereal market showed strong promotional impact on A and B products (correlation coefficient 0.82 vs <0.1 for D and E). Retailers can more effectively steer demand toward better-rated products.
| Nutri-score rating | Volume change 2024 | Promotion correlation |
|---|---|---|
| A | -0.4% | 0.82 |
| B | -2.7% | 0.82 |
| C | -4.6% | – |
| D | – | 0.1 |
| E | – | 0.1 |
Influence on supply
Nutri-score also affects supply: it pushes manufacturers and retailers to reformulate products. In breakfast cereals, this is clear. Between 2005 and 2023, one manufacturer reduced sugar by 32%, salt by 55%, and increased whole grains by 47%.
Chocapic illustrates this: it moved from B in 2020 to A in 2022 after reducing sugar by 42%, salt by 57%, and increasing fiber by 114%. The manufacturer reports increased sales after achieving A.
Nutri-score is also shaping innovation. Some products are designed from the outset to reach A, B, or C ratings, sometimes requiring years of development.
Ongoing controversies
Controversies persist around four themes:
- scientific methodology
- traditional products
- industrial freedom
- national sovereignty
What this transformation reveals
Nutri-score reflects a broader shift: consumers now arbitrate between health, clarity, trust, and values—not just price and taste. Its strength lies in simplifying complexity, but this also creates tensions.
Nutriscore 2025: a stricter algorithm
The algorithm revision is a key milestone. Adopted in France in March 2025, it penalizes sugary, salty, and fatty products more harshly.
France as a testing ground
France illustrates both adoption and conflict. In March 2026:
- 71% support generalization
- 41% say it strongly influences them
- 54% systematically choose the best-rated product

Frequently asked questions
Does Nutri-score really influence consumer purchases?
Yes, the data is clear. In 2024, 33% of French consumers stated that they had been influenced in their purchasing decisions by the Nutri-score. Even more revealing, products rated A are more resilient during economic crises (-0.4% decline vs -4.6% for C-rated products in 2024). This influence is particularly evident when the logo is visible and consumers can compare several products within the same category.
Why don’t all products display the Nutri-score yet?
The Nutri-score remains a voluntary scheme in France and across Europe. In 2024, only 33% of food products displayed it. Private-label brands are more advanced (53%) than national brands (24%). Some manufacturers are still hesitant, especially those whose products receive less favorable ratings. Others are waiting to see how regulations evolve before committing more broadly.
Did the Nutri-score algorithm really change in 2025?
Yes. Version 2 of the algorithm, adopted in France in March 2025, is stricter. The sugar penalty threshold dropped from 4.5g to 3.4g per 100g, and the maximum sugar-related penalty increased from 10 to 15 points. As a result, in the sweet grocery segment, the share of children’s cereals rated A or B could fall from 37% to 18%. This revision aims to better differentiate products within the same category.
Does Nutri-score really push manufacturers to reformulate their products?
Yes. The breakfast cereal category is a strong example: between 2005 and 2023, one manufacturer reduced sugar content by 32% and salt by 55%. Chocapic moved from B in 2020 to A in 2022 after reducing sugar by 42% and salt by 57%. Some product ranges are even designed from the outset to achieve an A rating, sometimes requiring years of development.
Can we trust studies on the effectiveness of Nutri-score?
Scientific studies on Nutri-score are generally reliable. A 2023 meta-analysis shows that among 111 studies favorable to the system, only 1.8% present a conflict of interest or private funding. Most research is conducted by public institutions such as Inserm or universities. However, as with any public health topic, it is important to cross-check sources and prioritize peer-reviewed studies.
![Illustration of our post "LinkedIn Top Voice: who are these influencers? [Research]"](/blog/app/uploads/algorithme-linkedin-2022-120x90.jpg)