Companies are keen on obtaining as much data as possible on their customers to improve behavioral profiling. Yet, few companies harness the power of their customers to enrich their data with new types of data, allowing new segments to be created.
In today’s article we’d like give you two examples of how online journals are using their customers to categorize their articles differently and improve recommendations.
Like and dislike: the most basic type of segmentation
Like and dislike are the two most basic and binary ways to segment your user database. If someone likes a content, you may assume he/she wants to consume more of the same.
The dislike button is seldom used (except on YouTube where a “thumb down” button is available). Yet it’s a powerful way to improve recommendations and hence customer satisfaction. Spotify would for instance very much benefit from a “dislike” button.
Emotional segmentation
Facebook introduced a finer type of segmentation with their emoji. It’s however unclear to us how the emotional “tagging” of content affects your newsfeed. The Facebook recommendation algorithm remains indeed a black box.
This kind of emotional segmentation serves very clear goals on other websites however. Let’s have a look at two real examples.
Use case #1: Voici.fr
Voici.fr is a yellow press magazine. The online version provides readers with the possibility to rate content according to 5 categories: “Fun”, “Sniff” (which relates to sadness), “Buzz”, “WTF”, “Sexy”.
When readers vote, the content automatically gets new metadata attached to it. In other words a new category is created which allows to do quite a few interesting things.
For instance, if a reader has mostly voted for “fun” content, you may want to recommend him content that other readers have found funny.
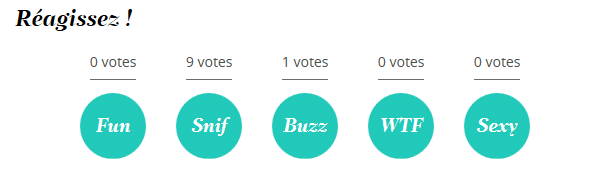
The votes of your readers can also help propose a new categorization of your content. This one is already implemented by Voici.fr as you can see from the screenshot below.
Use case #2: 7sur7.be
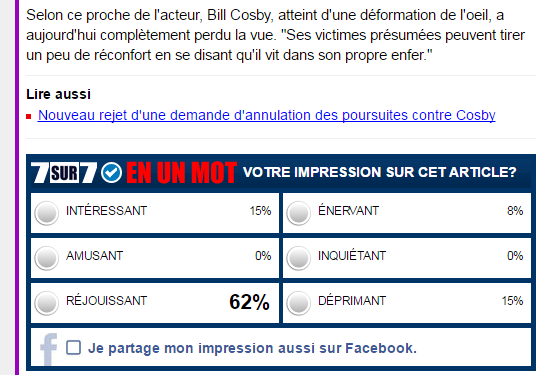
Belgian newspaper 7sur7.be uses a similar way to categorize content. It uses a solution provided by GraphyStory and rates content along 6 categories: “interesting”, “funny”, “cheerful”, “annoying”, “worrying”, “depressing”.
The votes are then used to –unsurprisingly- recommend the 5 top articles of each category.
Advices for you Big Data strategy
While it remains unclear how the tags were chosen by Voici.fr and 7sur7.be, it is obvious that they are used to categorize content along an emotional scale.
Companies using Big Data to promote content or sell merchandise should remember that their customers can also help create meaningful ways to cluster products. These new clusters can in turn serve your segmentation strategies and help find new correlations.