In this article, we present 4 methods for measuring traffic flows at the location of your future point of sale. Studying your location before setting up a shop is a key factor for success in retail.
For your local business to flourish, there is one golden rule: study the location of your outlet before you start. Location determines 50% of a business’s success. Unfortunately, too many shopkeepers still believe customers will come to them regardless of distance. There is only one solution: analyze traffic flows to avoid problems. The more traffic you have near your future location, the greater your chances of making money. In this article, I will explain how to measure these flows.
I want to validate the location of my outlet

Understanding the concept of catchment area
Understanding the “catchment area” concept is essential to succeed in the convenience retail sector. This is the area from which the majority of your customers come. For most businesses, this area is small. We often speak of catchment areas within a radius of less than 500 meters in downtown convenience stores. In the fast-food sector, it is common to measure catchment areas with a 100 to 150-meter radius.
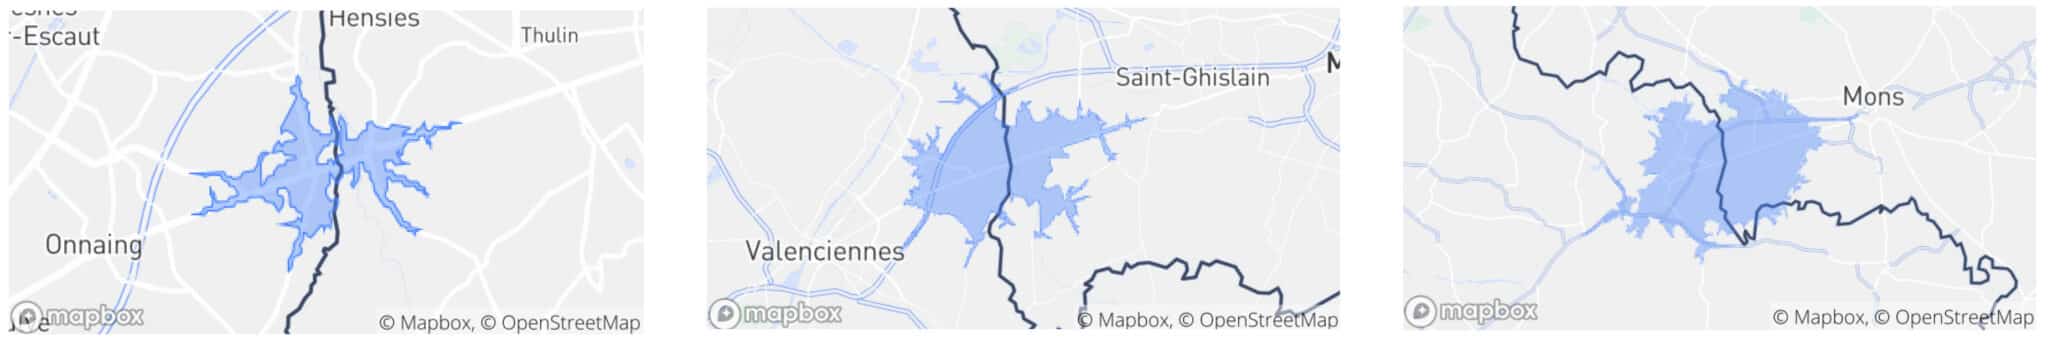
Comparison of catchment areas based on car travel. The isochrones are 5 minutes (left), 10 minutes (center) and 20 minutes (right). Note that the catchment area is not symmetrical and depends on the road network.
Why is the downtown area so small? Because most customers come on foot. Naturally, the catchment area is larger on the outskirts of towns and rural areas, where customers travel by car. This is why research into catchment areas is generally based on isochrones. An isochrone is an imaginary line representing an area x minutes from the location under study.
Travel time depends on the type of destination. For a fast-food outlet, the maximum travel time will be a few minutes. An amusement park could be several hours. The values given in the table below are averages. Remember that each case is different and depends on several variables: competition, population density, road network, etc.
| Type of business | Maximum travel time |
|---|---|
| Bakery/convenience store/fast-food outlet | 5-10 minutes |
| Supermarket | 15-20 minutes |
| Restaurant | 20-30 minutes |
| Shopping center | 30-45 minutes |
| DIY store | 30-45 minutes |
| Furniture store | 45-60 minutes |
| Cinema | 20-30 minutes |
| Hospital | 30-45 minutes |
| Amusement park | 60-90 minutes |
Flow analysis: Why it is essential in retail
The previous paragraph should have made you aware of the importance of the concept of catchment area in the retail sector. Now that the territory (the catchment area) has been defined, it is time to determine its most promising locations.
That is what a flow research study is for: determining the locations that attract the most potential customers. The differences can be gigantic from one street to another, from one sidewalk to another.
Research can be conducted in 2 ways:
- Quantitative flow analysis: how many pedestrians, cars, etc., pass through a given area?
- Qualitative analysis: what types of people pass through this location, and do they correspond to the customer profiles you wish to attract to your outlet?
Different methods exist to answer these questions. We explain the 4 possible approaches in the following paragraph.
Request a quote from IntoTheMinds Market Research agency
4 methods for measuring flows
There are different methods for measuring flows. The choice of method depends on the type of flow to be measured: pedestrians, cars, etc. 4 variants exist, as detailed below.
Measurement by extrapolation
Passenger flows are measured by taking 1 5-minute measurement point per hour and then gridding the streets in the area to understand flow dynamics. This type of approach is very rudimentary but easy to implement. However, the margin of error is quite high, as the measurement does not consider variations over the day, week, etc.
Moreover, if only one person conducts the measurement, the results will not be comparable. The measurements will have been conducted at different times of the day.
There are many limitations, but the advantage is that this method is extremely easy and inexpensive to implement.
Exhaustive measurement over a week
Passenger flows are likely to vary from one moment of the day to the next and from one day to the next, so the most reliable method is to measure them continuously. To do this, choose a “normal” week (excluding vacation periods and normal weather) and measure continuously from Monday to Saturday. Measurement times can be adapted to suit the nature of the business. For example, for a catering business (HoReCa) open for lunch and dinner, there is no need to take measurements before noon.
Video flow analysis
It is also possible to conduct continuous video recordings to categorize passers-by and obtain detailed qualitative data. In this way, we can determine the match between the people passing by on the street where the business will be located and its positioning. For example, if your establishment is aimed at the under-25s, it would be best if this clientele were naturally present in the traffic flow. Only a qualitative analysis will reveal this.
Analysis based on GPS data
This map (known as a heat map) shows pedestrian flows in downtown Brussels. The data displayed comes from pedestrians’ smartphones and once aggregated, can be used to quantify flows at street level.
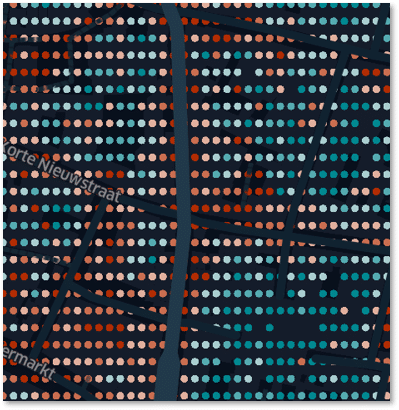
Each dot on this map represents an 8 x 8-meter area within which the number of smartphones passing through during a given time interval is counted. The redder the dot, the greater the number of users. This method makes it possible to precisely measure traffic flows on several streets, a district, or even a city scale.
It is now possible to measure traffic flow passing in front of a point of sale using data sent by smartphones, and in particular GPS data. The latter have a precision of +/- 8 meters, making them particularly useful for quantifying flows in front of a point of sale. This precise quantification can be conducted by hour, day, week, or month. All levels of granularity are possible. Of course, this approach (far less expensive than the others) also has its drawbacks, notably that it gives you no information on the type of people making up the flows. But it is an extremely useful approach, which, thanks to its attractive price, can be a good first step in choosing an address for a sales outlet.
Budget for flow research
- 2,500€ for one-off surveys
- Around €5,000 for a 6-day continuous survey.
- From €6,000 for a qualitative analysis based on continuous video surveys
- From €1,000 for an address measurement based on GPS data
Ensure the success of your local business! Contact us to check that the location you have found is the right one.