In this article, I explain how to use flow data (cars and pedestrians) as a factual basis for a territorial marketing project.

Territorial marketing projects often rely on qualitative approaches (interviews, focus groups). The use of quantitative methods is less common, which is why I wanted to write this article. It was inspired by a tender launched by the Valenciennes Region (France). The project’s goal was to revitalize an abandoned industrial area on the border between France and Belgium.
A territorial marketing agency that received the tender contacted us to propose an approach that would provide objective and reliable data. I’ll walk you through our methodological proposal in detail and explain its added value for this type of tender.Contact IntoTheMinds for your market research projects
Territorial Marketing Must Also Use Quantitative Data
In our work as a market research agency, we collaborate with many marketing agencies. For years, we’ve noticed that 99% of these agencies rely solely on qualitative methods to fuel their creative work. These methods have their advantages, but they don’t allow for definitive conclusions. Quantitative methods, on the other hand, do.
In the case of the territorial marketing project submitted by the Valenciennes Region, it seemed to me that the objectives outlined in the specifications were unattainable with qualitative methods alone. How can you make such significant decisions based only on focus groups or qualitative interviews? We needed objective, observed data about the people passing through the area to be revitalized. These are called mobility data.

Why Are Mobility Data Essential?
A territorial marketing exercise cannot be conducted without considering both sides of the equation:
- The opinions of people living in the area.
- Data on the movements of all types of people (residents and non-residents).
The core of our proposal was to provide a solution that offers an objective view of people’s movements in the area. This approach answers critical questions for the area’s valorization:
- Who are the people passing through the areas to be revitalized without stopping? Where do they come from, and where are they going?
- What proportion of people work on-site?
- What distances do people living in the area travel to go to work?
Get data for your territorial marketing project
Methodological Approach
The method described below allows us to characterize movements in a specific geographic area and profile the people behind them. This enables us to answer the questions raised in the previous paragraph.
Determining Flows in the Areas
To start, we assigned the various plots of land to an IRIS zone. For each of these zones, we capture GPS signals from smartphones passing through. We’ve been using this proprietary technology since 2019 with highly reliable results. Our database contains approximately 15 million anonymized identifiers, making it perfectly representative of the French population.
More specifically, a person is counted from the moment they enter the zone and stay for more than 10 minutes. This indicator includes both pedestrians and vehicles. The same person is counted once per day.
This allows us to provide precise results on the origins of different individuals. The results reflect the past 12 months of activity, eliminating the effects of seasonality.
To help you fully grasp the advantages of this method, we provide an example below. We selected a zone with multiple plots in the commune of Quiévrechain. A GPS point was chosen at the centroid of the zone (see below).
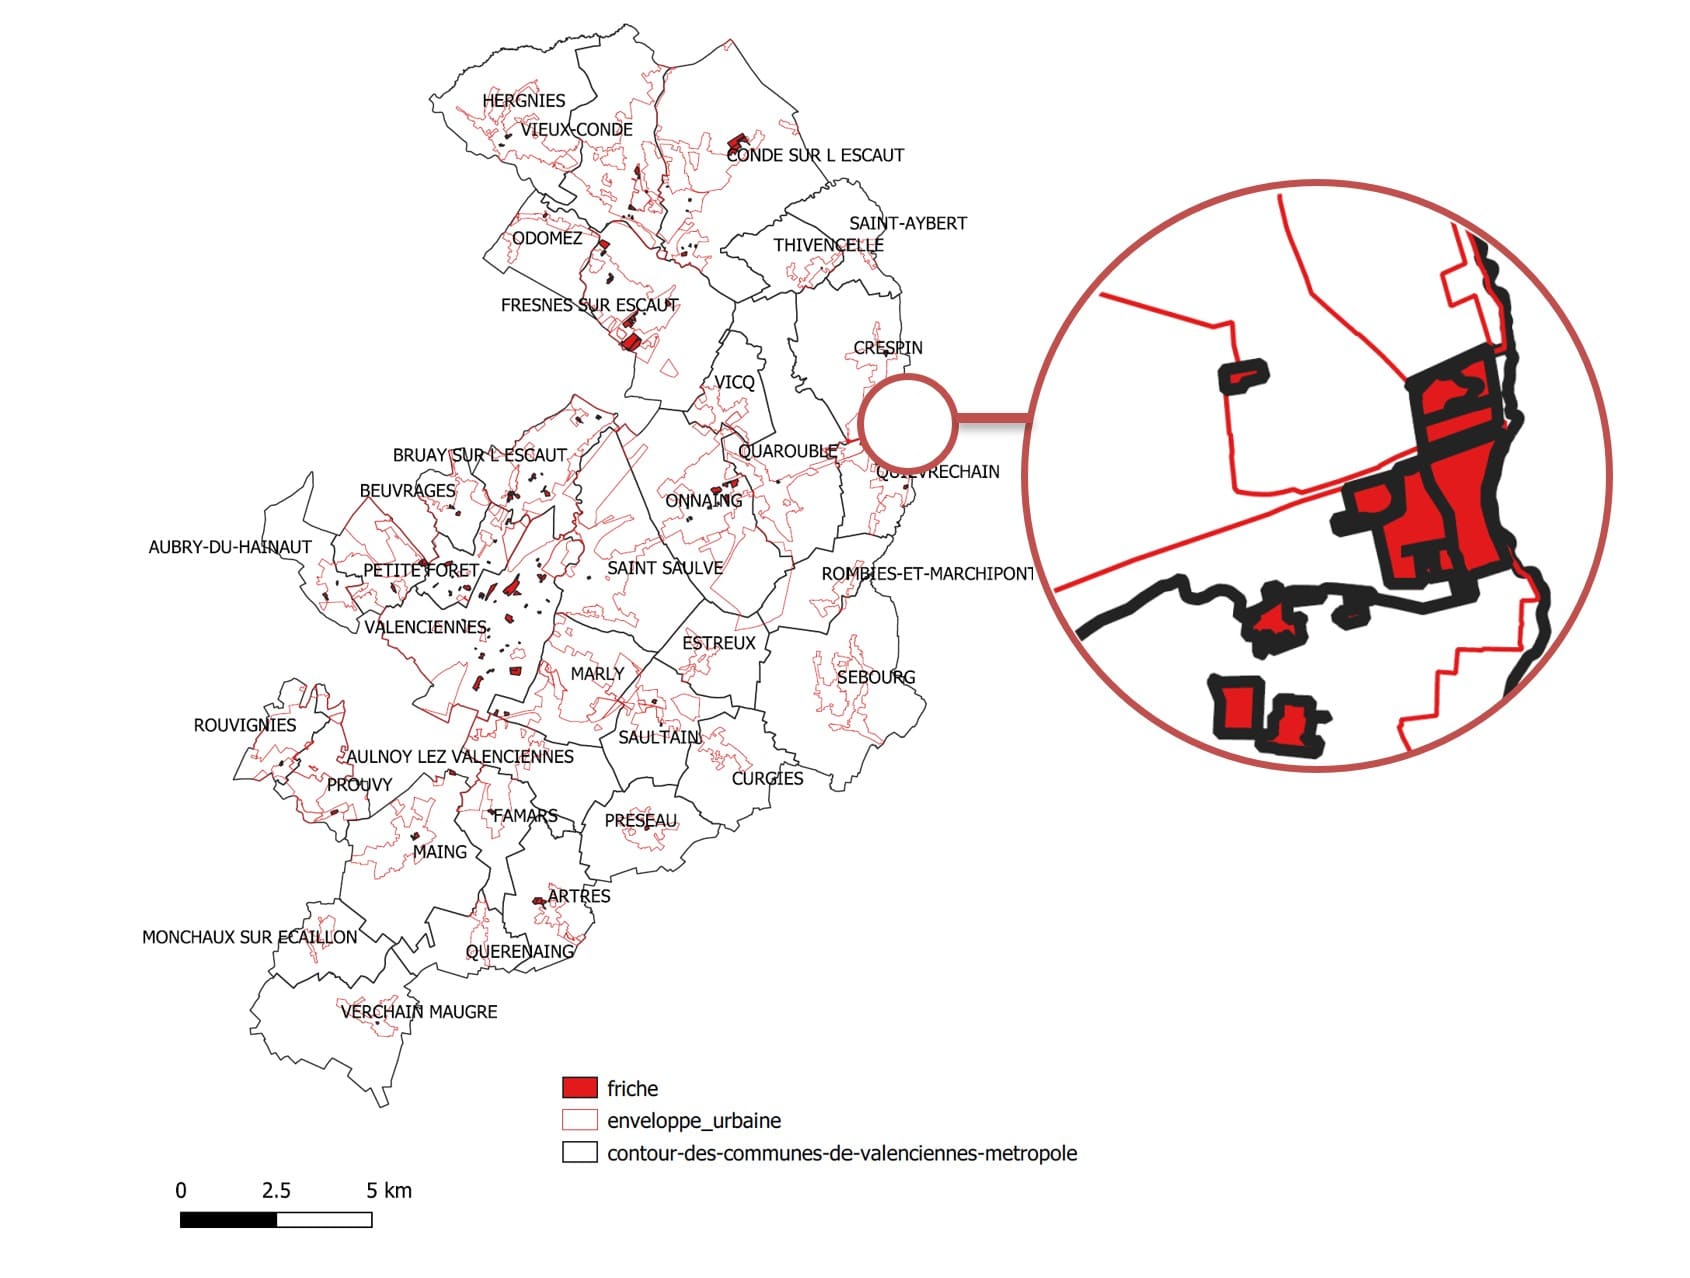
This map represents the area whose plots were to be revitalized through a “territorial marketing” approach. On the right side of the image, a plot is zoomed in on. This is the area for which we collected flow data to include in our response to the tender.
We then acquired 12 months of data on all traffic in the zone. This allowed us to precisely determine:
- Where the people passing through live.
- Where the people passing through work.
This enables us to visualize the neighborhoods where the people passing through live (see below).
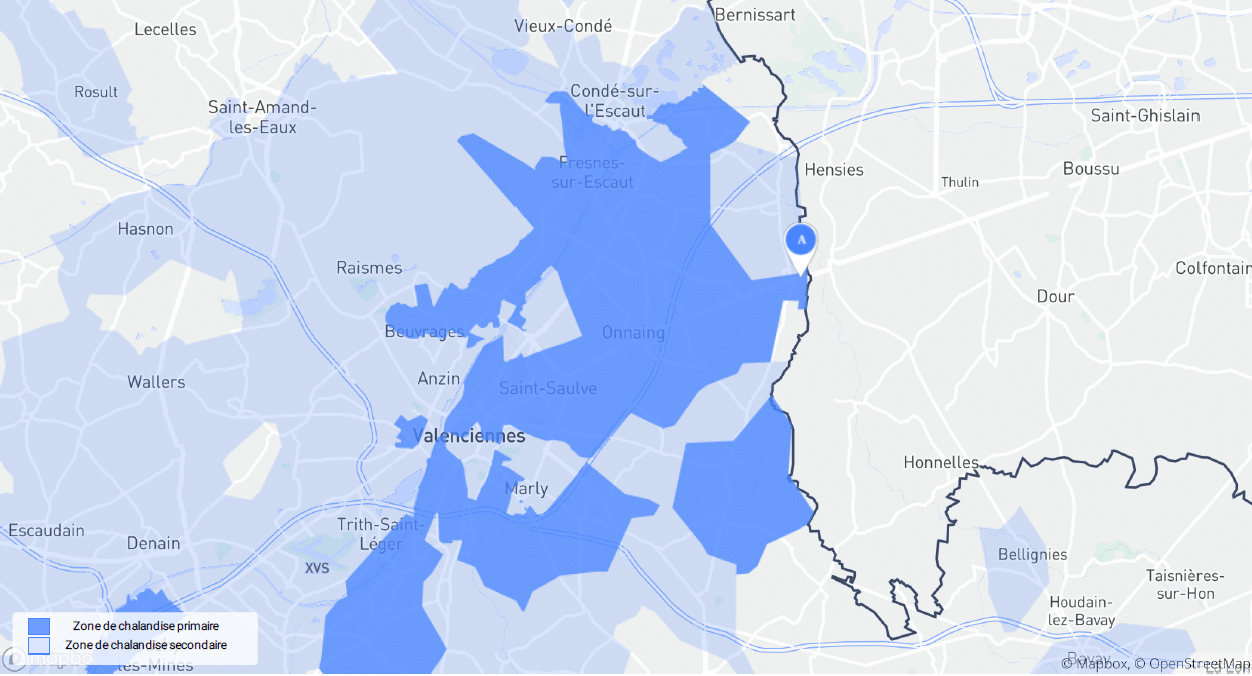
This map allows us to locate the geographic origin of the people passing through the area to be revitalized.
We repeated the process for the work zone. The results are visualized at the neighborhood level.
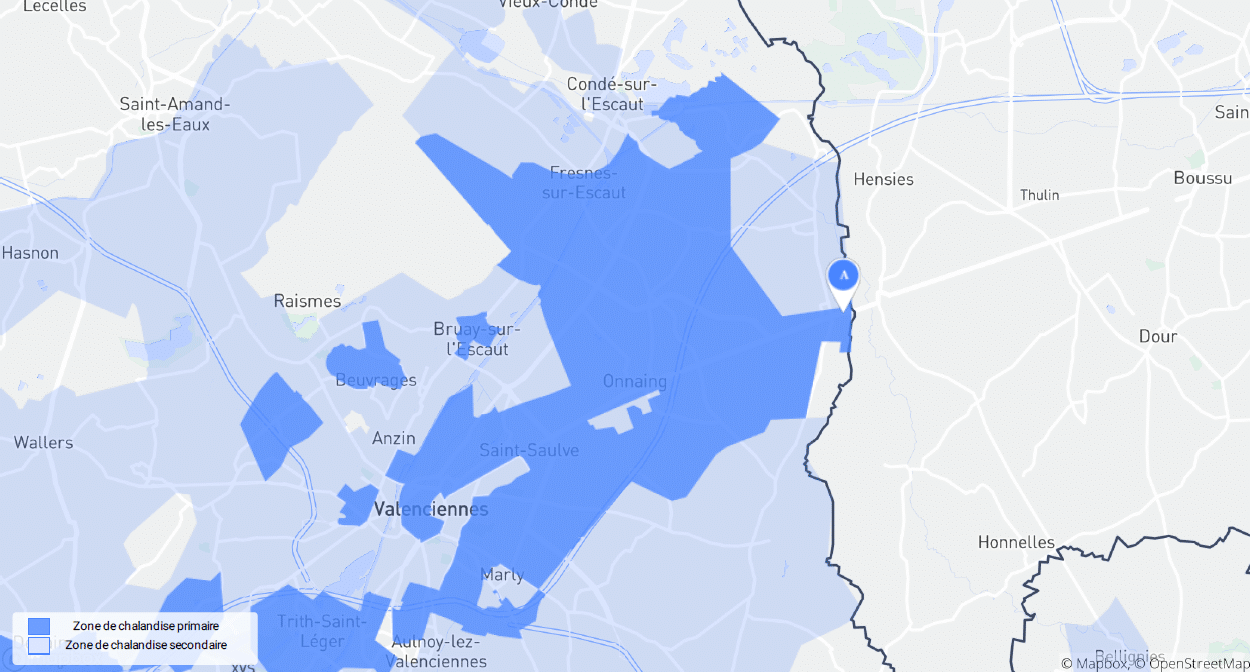
This map allows us to locate the geographic origin of the people working in the area.
Contact us for your territorial marketing project
Quantifying Flows by IRIS Zone and Comparison
Finally, we quantify the flows within each IRIS of the 34 communes, following the same rules as before. The flows are then normalized, and the differences are represented on a scale from 0 to 100. The value 100 corresponds to the IRIS with the highest footfall in the past 12 months.
A map is prepared using Tableau software, which visualizes the differences between IRIS zones through colors.
By cross-referencing footfall data by IRIS with origin data, it becomes possible to rank the different zones based on their potential for the following two purposes:
- Work
- Residence
Profiling People Passing Through the Different Zones
Lastly, we conduct a socioeconomic analysis. For each of the previously determined zones, we create a socioeconomic profile of the people, assess annual incomes, and quantify the zone’s size (in terms of population and households). This profiling is done for different isochrones:
- At 5, 10, 15, 20, 25, and 30 minutes on foot from the zone.
- At 5, 10, 15, and 20 minutes by car from the zone.
Below are two examples of the results obtained.
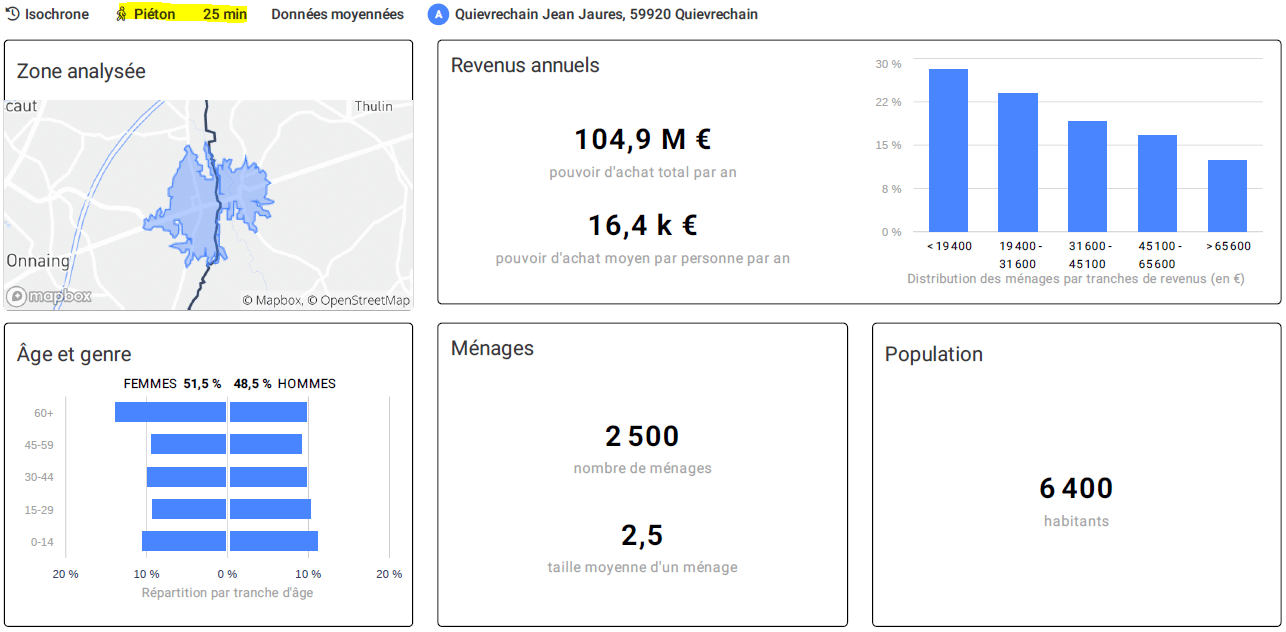
This map, called an isochrone, represents the territory that can be covered in all directions by walking for 25 minutes. This 25-minute catchment area is then cross-referenced with sociodemographic data to characterize the population within it.
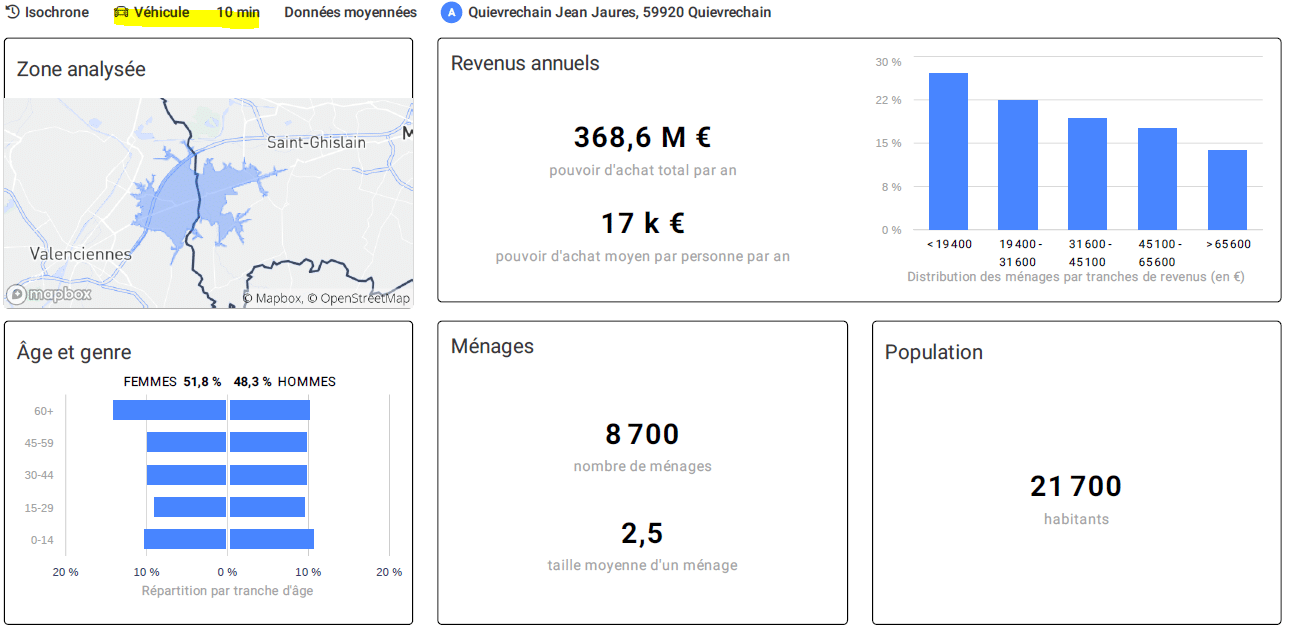
This map is based on a 10-minute car isochrone. The territory is therefore much larger than its pedestrian equivalent. The road network determines the shape of the 10-minute catchment area and provides insights into opportunities for commercial establishments.
The data obtained will, in phase 3, facilitate the selection of plots to be valorized based on the attractiveness of the catchment area. It will also enable the client to make informed decisions to ensure alignment between the type of project developed and the purchasing power and age distribution.