
To conduct a price study, you can use the Van Westendorp technique. In this article, I will guide you step by step through how to apply it and even provide you with a template to download in Excel format.

Setting the right price for a product or service is strategic. Too high, you lose customers. Too low, doubts about quality arise. Fortunately, there are different pricing methods. Pricing studies naturally fit into a broader market research approach, which can be conducted by an experienced market research firm (like ours 😉). Among the most reliable techniques, the Van Westendorp method stands out for its simplicity and effectiveness. It is the one we use most often to “explore” a market. In this article, I give you a concrete project example carried out for Europcar. You can also download a model in Excel format that will generate the curves and determine the price range for you.
Contact us for your pricing studies
Key takeaways
- The Van Westendorp method is based on collecting data that correspond to measuring price sensitivity
- The model is built by asking 4 simple questions to future customers
- Thanks to Van Westendorp, you can conduct tests to determine the optimal price and the acceptable price range for your product/service
- Developed in 1976, this technique remains one of the most used in pricing
- Perfect for new products without direct competitive reference
- Combines effectively with other methods like Gabor-Granger
What is the Van Westendorp method?
The Van Westendorp method, also called Price Sensitivity Meter (PSM), was developed in 1976 by the Dutch economist Peter Van Westendorp. This simple but effective technique allows testing customer price sensitivity without directly asking them how much they would be willing to pay. It is therefore an essential marketing tool. And yet, I am surprised every day with our clients how little known it remains (like other pricing methods for that matter).
The principle is quite elegant. Rather than asking the direct question “How much would you be willing to pay?” to measure your customers’ purchase intention, perceptions of price are explored through four different angles:
- Question 1: is the product too expensive?
- Question 2: is the product expensive but perceived as premium?
- Question 3: is the product cheap/good value for money?
- Question 4: is the product too cheap?
This indirect approach reveals valuable insights into customer purchase psychology.
The Van Westendorp price analysis proves particularly relevant for companies launching innovative products or operating in markets where pricing references are unclear. It offers a reliable compass for making pricing decisions.
In the rest of this article, I will guide you through a concrete example from which you can download the model as an Excel file.
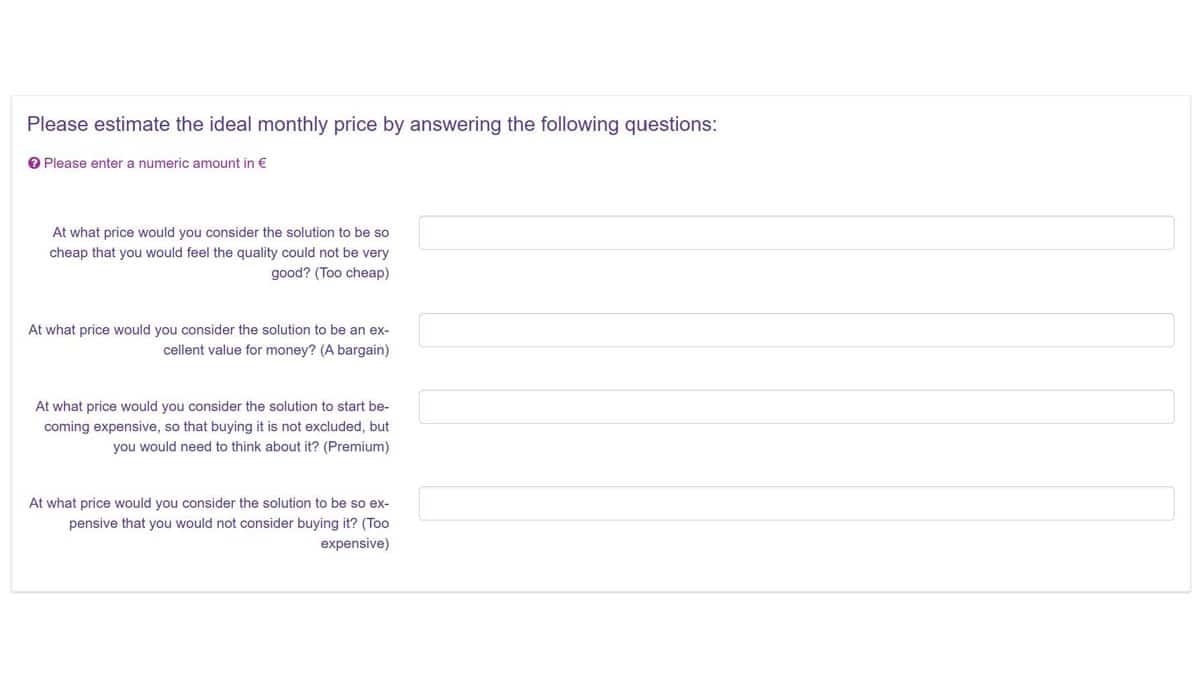
Here are the four questions to ask (only four, which is the beauty of the method) to conduct your price study using the Van Westendorp method.
The 4 Van Westendorp questions
The heart of the Van Westendorp method lies in four simple but effective questions. As I wrote in the caption of the illustration above, that’s the beauty of the method. Each question explores a different facet of price perception:
- Excessive price threshold: “At what price would this product seem too expensive for you to buy?”
- High price threshold: “At what price would this product seem expensive, but you would still be likely to buy it?”
- Attractive price threshold: “At what price would this product seem cheap?”
- Suspicious price threshold: “At what price would this product seem too cheap to buy, because you would doubt its quality?”
These questions allow mapping the consumer’s mental universe facing price. They reveal not only financial limits, but also associations between price and perceived quality.
The art lies in formulation: questions must be neutral, without orienting responses. The product presentation context also influences results, hence the importance of preparing this step well.
How to analyse the results?
Van Westendorp data analysis follows a methodical process that transforms raw responses into actionable insights. Here is how to proceed step by step.
Step 1: Data preparation
Start by organising your responses in a spreadsheet. For each question, calculate cumulative frequencies. Note: the “expensive” and “cheap” curves must be inverted to obtain percentages of consumers who consider prices acceptable. You can download the ready-to-use Excel model here. It contains dummy data that you can easily replace with your own.
Step 2: Building the graph
Create a graph with prices on the x-axis (X) and cumulative percentages on the y-axis (Y). Plot four curves corresponding to the four questions. The intersection of these curves reveals key points for your pricing strategy.
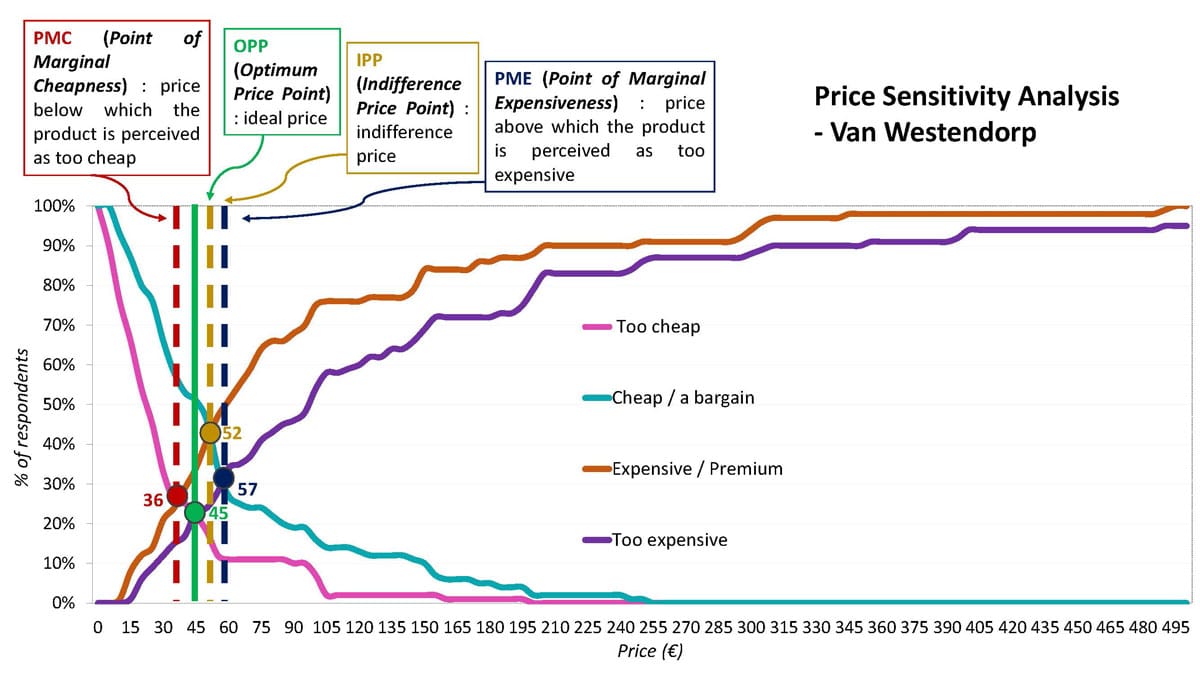
The price sensitivity test analysis reveals a price range perceived as acceptable between £36 and £57. Below £36, the solution is considered too cheap. Above £57, it begins to be perceived as too expensive. The point where perceptions of ‘cheap’ and ‘too expensive’ meet is £45, which is the ideal price.
Step 3: Identifying critical points
Three intersections are particularly important:
- The Optimal Price Point (OPP): intersection of the “too expensive” and “(too) cheap” curves. This is your reference price, the one that minimises purchase resistance. It is represented in green on the graph above.
- Marginal cheap point (PMC): intersection of the “(too) cheap” and “premium” lines. Signals an acceptability threshold, suggesting that if the price is set below this level, consumers might doubt product quality and harm brand image.
- Marginal expense point (PME): intersection of the “too expensive” and “good deal” lines. Beyond this threshold, consumers judge the product “too expensive”, which can lead to decreased sales if the company sets prices above this level. Customers are then likely to turn to alternatives perceived as more affordable.
Determining your strategic price range
Beyond the optimal price, the Van Westendorp method reveals your tariff manoeuvre margin. This acceptable price range delimits your commercial playground.
The upper limit is at the intersection of the “cheap” and “too expensive” curves. Beyond this threshold, called Marginal Sensitivity Point, purchase resistance becomes too strong. Crossing this limit exposes to sales drop and brand image degradation.
The lower limit corresponds to the crossing of the “too cheap” and “cheap” curves. Below this Economic Marginality Point, consumers doubt quality. A price too low can paradoxically harm sales.
This price range constitutes your commercial comfort zone. Within these limits, you can adjust your pricing according to your strategy: premium positioning, volume, or value-price balance.
| Key point | Meaning | Strategic use |
|---|---|---|
| Optimal Price (OPP) | Minimal purchase resistance | Recommended reference price |
| Indifference Point | Price perception balance | Alternative to optimal price |
| Upper limit | Maximum resistance threshold | Ceiling of your pricing |
| Lower limit | Quality suspicion threshold | Floor of your pricing |
Contact IntoTheMinds for your pricing studies
Advantages and limitations: pros and cons
Like any method, the model proposed by Van Westendorp has undeniable strengths, but also some shadows to know.
The strengths that make the difference
- The simplicity of execution is the first advantage. Four questions are enough to obtain a first price range. No need for complex protocols or gigantic samples. This type of pricing model is applicable with samples from 250 respondents (I however recommend questioning at least 400 people). This accessibility democratises pricing studies for companies of all sizes.
- The intuitive analysis represents another major asset. The graphs speak for themselves, facilitating communication of results to non-technical teams. A sales director immediately grasps the issues without prior training.
- The versatility of the method also impresses. It adapts to all types of products and services, from consumer goods to B2B services. This flexibility makes it a reference tool for many sectors.
The limitations to keep in mind
- The main drawback lies in the lack of consideration of product characteristics. Consumers evaluate price without precisely knowing offer specificities. This limitation can bias results for complex or highly differentiated products.
- The method also assumes consumers have a clear mental representation of the evaluated product/service. For breakthrough innovations, this hypothesis can prove fragile.
- Finally, Van Westendorp does not capture competitive dynamics. Alternative prices are not integrated into the analysis, which can limit recommendation relevance on highly competitive markets.

Practical tips for succeeding in your pricing study
To maximise the value of your Van Westendorp analysis, some best practices are essential.
- Care for product description: Even if the method does not detail characteristics, a clear and neutral presentation remains essential. Avoid too technical or marketing terms that could influence responses. I refer you here to my guide for questionnaire creation in which I listed best practices to follow.
- Adapt your sample: 200 to 300 respondents are generally sufficient, but ensure they well represent your target. A biased sample will produce unusable results.
- Test several variants: If your product exists in several versions, conduct separate analyses. Price perceptions vary according to characteristics, even for close products.
- Combine with other methods: Van Westendorp excels in first approach, but gains from being completed by techniques like Gabor-Granger or conjoint analyses to refine results.
- Update regularly: Price perceptions evolve with market, competition and consumption habits. An annual study allows staying in phase with your market.
When to use Van Westendorp?
The Van Westendorp method is suitable in specific contexts.
- It proves particularly relevant for price tests before the launch of an innovative product where competitive references are lacking. In these situations, it offers valuable first insight into market price expectations and will allow orienting your marketing decisions.
- Companies in repositioning phase also find their account in this approach. When you want to test a new pricing strategy, Van Westendorp reveals acceptable change limits.
- For emerging or niche markets, where competitive data is rare, this method fills a crucial information gap. It allows avoiding gross pricing errors that can annihilate your marketing efforts.
- On the other hand, on highly competitive markets with standardised products, other methods like direct competitive analysis may prove more relevant. Van Westendorp then remains a useful complement, but not the main tool.

FAQ: Your questions about Van Westendorp
How many people to survey for a reliable Van Westendorp study?
A sample of 200 to 300 respondents representative of your target is generally sufficient. I however recommend 400 respondents. Beyond 500, precision gains become marginal. The important is representativeness quality rather than raw sample size.
Can Van Westendorp be used for complex services?
This method adapts perfectly to services, even complex. Just ensure to clearly present the evaluated service. For very technical services, a pre-explanation phase may be necessary.
How to handle aberrant responses in analysis?
Eliminate extreme values representing less than 5% of the sample. These outliers can bias analysis without providing useful information. Keep track of these deletions for methodology transparency.
Does Van Westendorp work for B2B markets?
Yes, but with adaptations. B2B decision-makers often reason in ROI and budget terms. It may be useful to contextualise questions by mentioning expected benefits or relating prices to relevant units (per user, per month, etc.).
What frequency to update a Van Westendorp study?
An annual update is a good rhythm for most markets. On very volatile sectors (tech, fashion), a semi-annual frequency may be justified. Conversely, for very stable products, every 2-3 years may suffice.


![Illustration of our post "Digitization: food & beverage industry companies lag far behind [Research]"](/blog/app/uploads/marche-alimentation-bio-long-120x90.jpg)