The organic market is undergoing a profound change. After rapid growth during the Covid, some markets experienced a slight contraction in 2021. However, not all European countries are in the same boat. Strong growth has been recorded in Germany (+5.9%), Austria (+15.2%), and Spain (+8.9%). Discover in this article the 2-speed dynamics of the organic market in Europe.
7 statistics on the organic market in Europe
- Austria has the highest organic market growth in 2021: +15.2
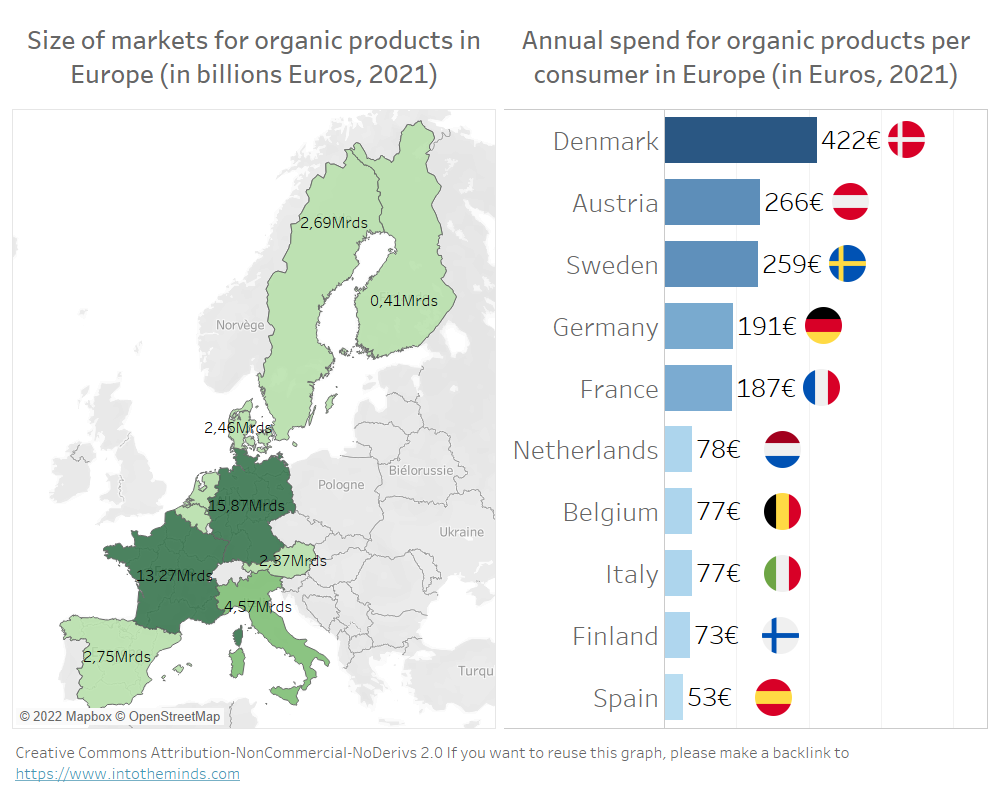
- The Danes are the ones who spend the most on organic products: 422€/person in 2020
- The British spend the least on organic products: only 50€/person in 2021
- The French, Swedish and Finnish organic markets have each lost 0.5% in 2021
- In absolute size, Finland is the smallest European market: 410m€.
- Germany is the largest organic market in absolute value: €15.87 billion
- 72% of Spaniards and 88% of Italians bought an organic product in 2020
Overview of the organic market in Europe
The figures for 2021 show significant differences between European countries. The organic market appears to be fragmented. There is a two-speed dynamic with some countries at the forefront (Denmark, Sweden, Austria, Germany, France) and others lagging.
The classic north/south divide no longer applies here since the United Kingdom, Finland, the Netherlands, and Belgium are also lagging. The expenditure per capita does not exceed 80€/year, while the French spend nearly 190€/year and the Danes 422€ (European record).
Launching an organic business requires reflecting on the target market and understanding its specificities.
Why is the organic market so heterogeneous in Europe?
The heterogeneity of the organic market in Europe is undoubtedly the result of differences in purchasing power. But not only.
Purchasing power
The first reason for the differences in purchasing organic products is, of course, the purchasing power. This may seem obvious, but as purchasing power increases, so does the ability of a household to invest in quality food. To realize this, you must look at the “Annual expenditure on organic products per capita” graph. The countries with the richest households are at the top of the ranking (AIC index, see also paragraph “market data”).
The AIC index helps to explain why the Danes (in 2nd position) spend more on organic products than the Spanish (in 15th position). But this is not enough to explain why the Finns, Dutch, or Belgians spend so little on organic products (less than 80€, like the Italians and Spaniards) while they are at the top of the ranking in purchasing power. To explain these anomalies, we must turn to the analysis of national markets.
Different market conditions
Each market has its specificities that help explain why spending on organic products varies so much from one country to another.
Let’s start with Finland. It is in 7th position in Europe regarding purchasing power, yet the expenditure on organic products per capita only amounts to 73€/year (behind Italy). The explanation? On the one hand, the local organic production is reduced because of the climate. On the other hand, the Finns are very focused on vegan and vegetal products, to the detriment of organic products.
For Sweden, we can give the same climatic reasons. Organic farming is less supported there, and they must import products for the most part. In addition, consumption habits favor local products and those in short circuits. The trade-off is, therefore, unfavorable to organic products.
In Germany, the strength of the organic market is historical. The Germans were the first in Europe to promote organic products. Today, organic products allow retailers to differentiate themselves from discounters (Aldi, Lidl), representing 40% of volumes and 60% of value.
In Spain, consumption has not taken off because the number one retailer (Mercadona, 30% market share) does not propose any organic products.
To conclude
This quick analysis of the organic market in Europe shows very significant differences between countries. If some explanations are found in the differences in purchasing power, the market’s specificities are also a major factor. This shows that in-depth market research is necessary to understand a market’s dynamics and avoid pitfalls.
Market data
| Country | The market size in 2021 (Billion Euros) | Market growth | Consumption per capita (in €) | Ranking in terms of purchasing power (source: Eurostat) |
| Denmark | 2,46 billion Euro | +5,5% | 422 € | 2 |
| Austria | 2,37 billion Euro | +15,2% | 266 € | 4 |
| Sweden | 2,69 billion Euro | -0,5% | 259 € | 6 |
| Germany | 15,87 billion Euro | +5,9% | 191 € | 3 |
| France | 13,27 billion Euro | -0,5% | 187 € | 9 |
| Netherlands | 1,60 billion Euro | +5,5% | 78 € | 3 |
| Belgium | 0,98 billion Euro | +4,6% | 77 € | 5 |
| Italy | 4,57 billion Euro | +4,9% | 77 € | 10 |
| Finland | 0,41 billion Euro | -0,5% | 73 € | 7 |
| Spain | 2,75 billion Euro | +8,9% | 53 € | 15 |
Posted in Marketing.

