If you are an entrepreneur, this article should be of interest to you. Today, we are offering you the opportunity to discover a tool that will allow you to carry out free market research in France. If ODIL (the name of the tool) will not allow you to carry out the entirety of your market research, it will nevertheless let you get started and will provide you with the first essential data to understand the characteristics of the geographical territory in which your company will operate.
At the end of this article, we also propose a summary table of the different types of statistics offered and their potential use in the context of the study of a specific market. Even if your business creation project is not in France, this table will be useful to you to know what figures to look for and for what purpose.
ODIL, a tool of INSEE (INSEE: The National Institute of Statistics and Economic Studies)
ODIL is the acronym (?) for a business creation tool. As the ODIL presentation page rightly points out, this tool allows you to start your market research. It is, therefore, by no means a tool that will enable you to carry out your entire market research.
Its geographical scope is -logically- limited to metropolitan France and overseas territories. Its functional scope is limited to certain activities that you can find here or below.
Start your market research with ODIL
ODIL will give you access to a certain amount of useful information for your market research and will also force you to question such fundamental concepts as the area of influence and the catchment area. At each step, we have taken screenshots that you will find, in chronological order, at the end of this article.

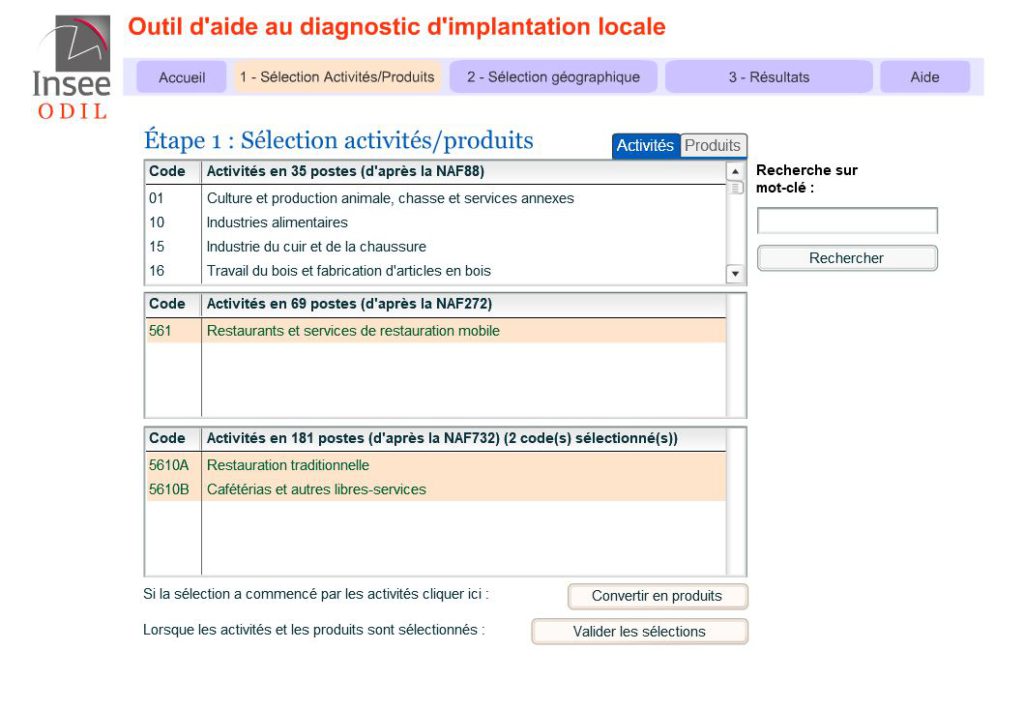
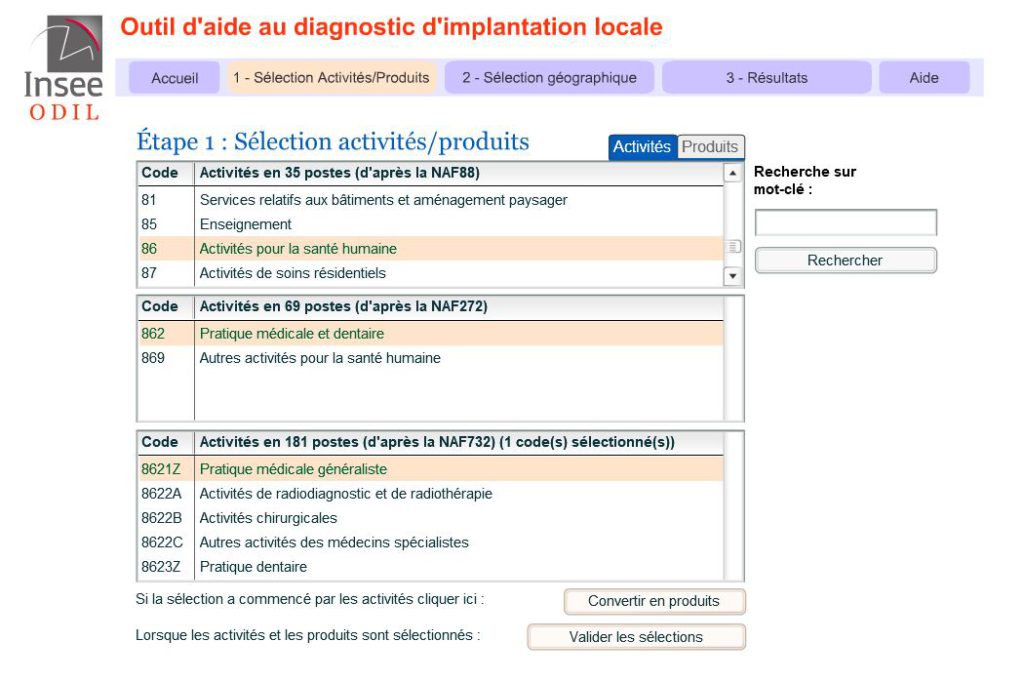
Stage 1: define your business sector
The first step is to select the sector of activity of your future business. There are two ways to validate this stage. You can either select the activity directly (through different filters) or use a product selector that will decide the corresponding business areas for you.
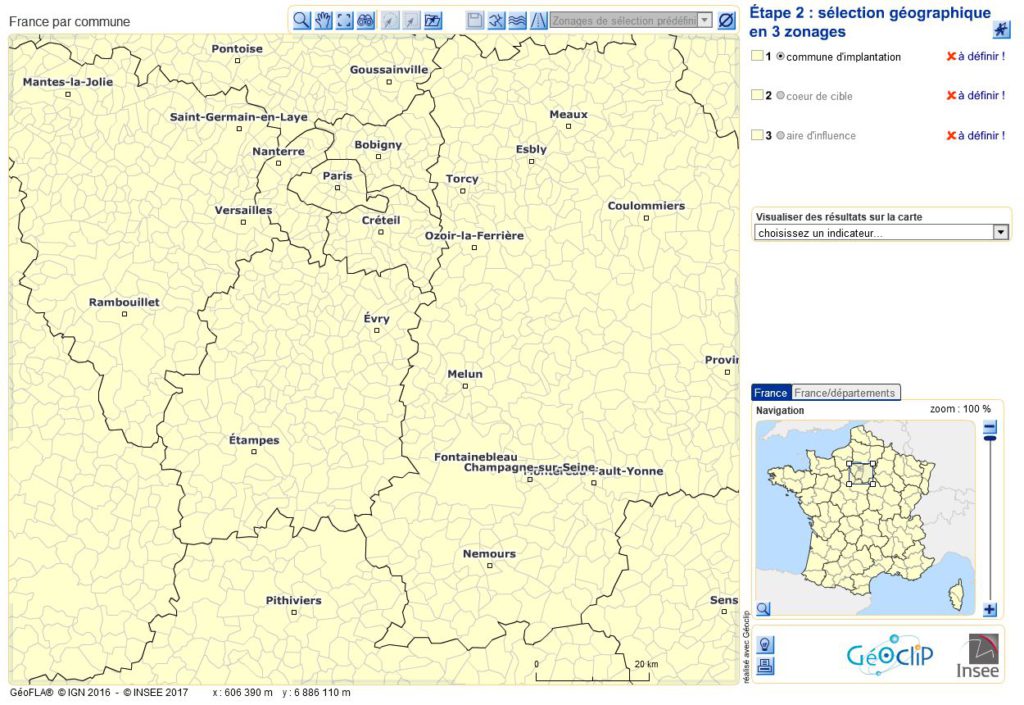
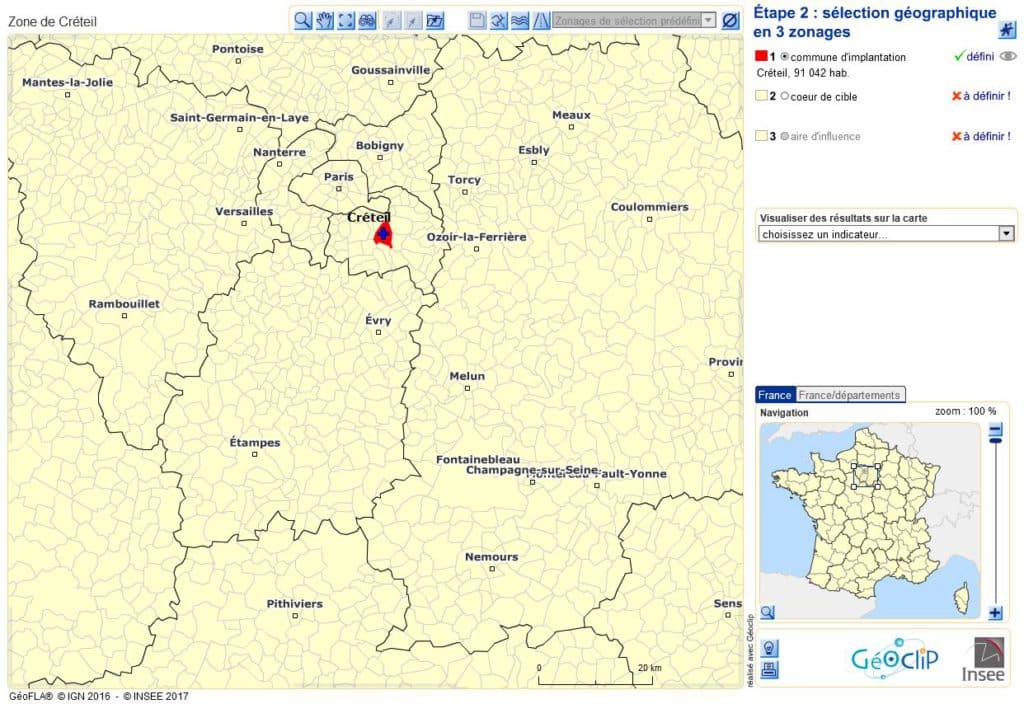
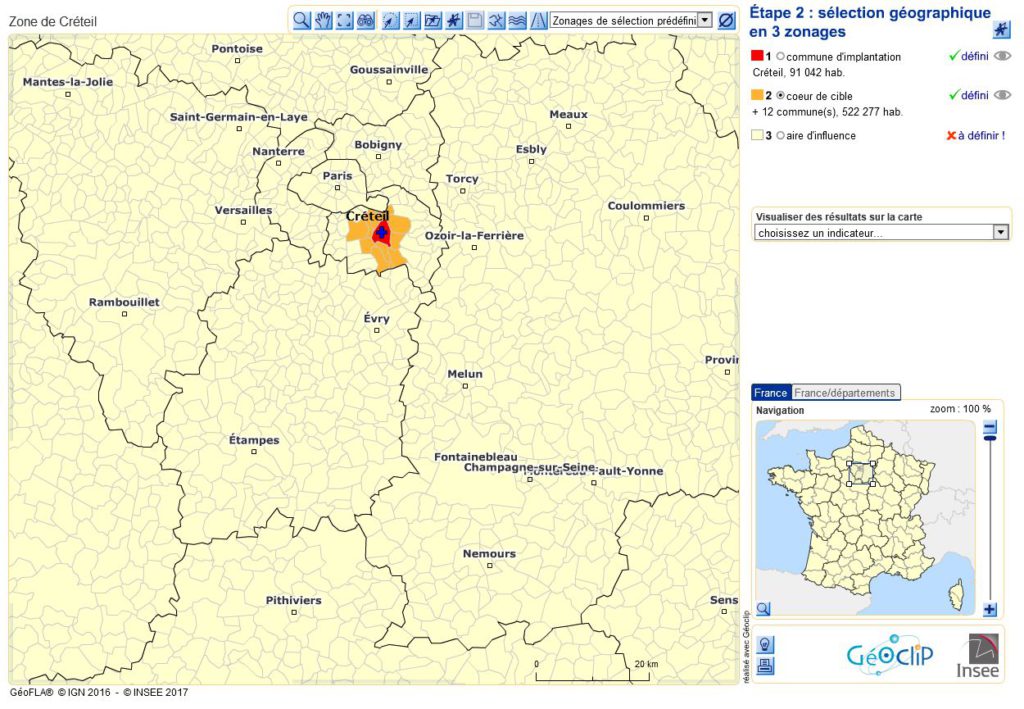
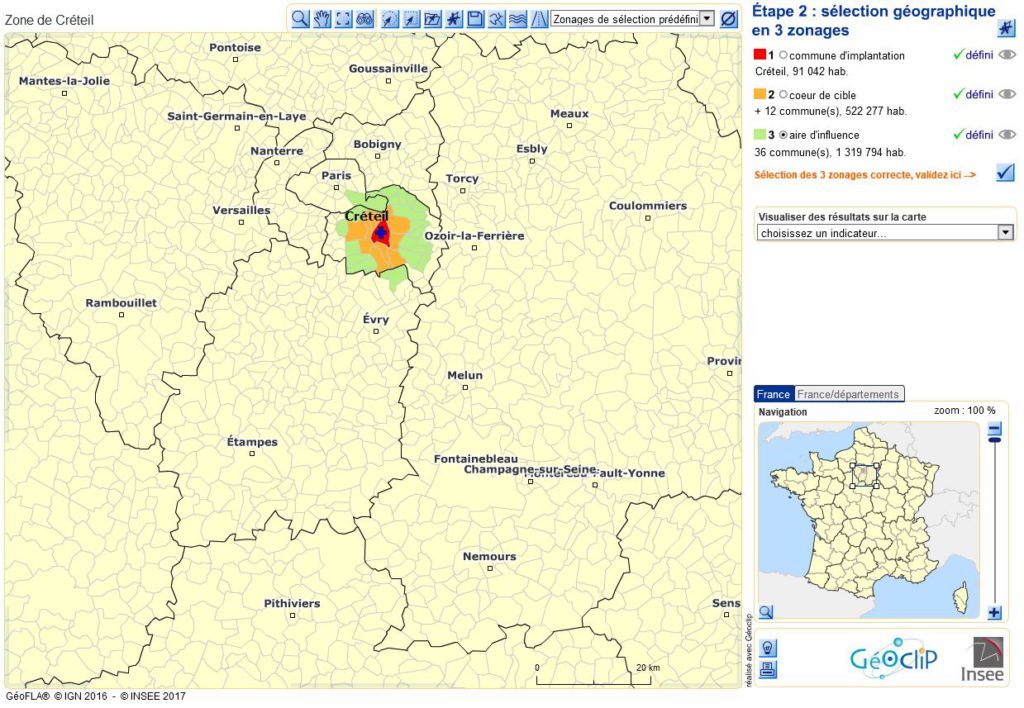
Stage 2: Geographical selection
The second stage consists in defining the three types of zones that are important for any market research:
- the location of the town
- the so-called “core target area” (i.e. the area from which the majority of your customers will come and which we could also call “catchment area”)
- the sphere of influence, i.e. the maximum geographical perimeter beyond which no more customers will come
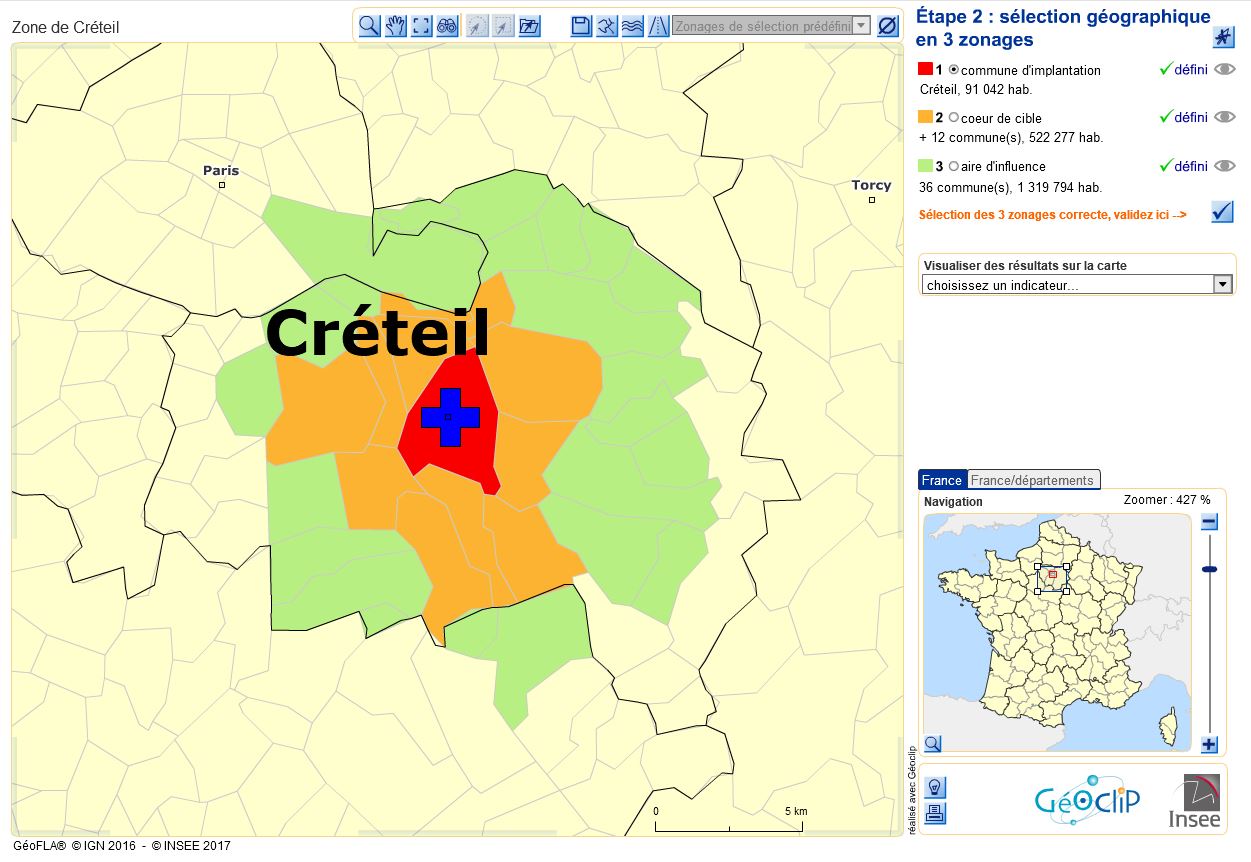
On the example below, we selected Créteil as a location town and defined two circular areas (then translated into towns, hence the poor similarity to a circle). The first zone (orange) corresponds to the core target; the green part to the zone of influence. If you do not wish to use the circular selection tool (see the arrow on the screenshot below), you can also select the communes in zones 2 ( the core target) and 3 ( the zone of influence) one at a time. It will take longer, but if you already have field knowledge of your location area, it may be more accurate to make a selection of this type.

Stage 3: Analysis of the results
Once the activity (or products) and the different geographical areas have been defined, the results are already available.
Of course, the results are general information. In this sense, it can only be information to use to start your market research. Therefore, do not expect it to be done automatically or without effort. The available results are obtained by clicking on the drop-down menu, where they are classified into two categories: local statistics and national statistics.
The types of statistics that are offered are the same regardless of the activity completed in the first stage; not all of them will necessarily be useful in your case. To simplify your analysis, we give you some indications in the table below of how you can use these different statistics in your market research.

Recap table on how to use the different statistics for your market research
| Statistics available on ODIL | Use in Market Research | Remarks |
| Establishments with the same activity | ODIL provides you with a complete list of companies in the defined zones 1+2+3 that carry out the same activity. This is very useful for your competition study because the work of identifying competitors is already done here. | For your competition study it is not enough to identify competitors. You will need to carry out a comparison and analysis of offers and customers in order to fully understand your future positioning in relation to your competitors. |
| Population | The population on the defined territory is of course an interesting statistic. It is better to set up your business in a densely populated area that will provide you with a large number of potential customers. | A large number of customers is useless if your facility is not easily accessible. Also consider studying the location of transport routes in rural areas, and the availability of public transport in urban areas. The “population” statistics must also be analysed according to the age (or any other variable) that makes sense for your activity. To use the example of this article (medical activity), a geriatrician would be well advised to settle in an area where the percentage of older people is higher. |
| Population by SPC / housing | If your product or services are aimed at a particular socio-professional category (SPC), it is in your best interest to look at these statistics with intent. | The positioning of your product or service will inevitably lead to a stratification of your potential customers. Purchasing power is reflected in the socio-professional category. Consider asking yourself upstream about the SPCs your future offer is most likely to correspond to. |
| Housing | The figures that can be obtained are of several types. Owner/tenant ratio on the one hand; type of housing (depending on the date of construction). | It is unlikely that these statistics will be used in the example studied (medical activity). For a company active in construction, on the other hand, the usefulness is obvious. It should also be noted that some of the same figures are available in the tab “population by SPC / housing”. |
| Households | The figures proposed are of two types. First of all, households by socio-professional category ( SPC); then household types (household without family, household with family, according to the number of children, and so on). | These figures are vital for all companies that provide, for example, person-oriented services or activities related to early childhood. |
| Workforce / Employment | ODIL gives you access to the number of people working in the different types of employment (craftsmen, employees, workers, managers, and so on) as well as the number of people working by age group and gender. The figures are absolute values, so you will have to calculate the percentages yourself by referring to the population tab. | The figures provided here are partly the same as those in the tab “population by SPC / housing”. |
| Employment / Education | Employment figures are divided according to job type (agriculture, industry, construction, trade, and so on). Training statistics are particularly interesting because they give you information on education levels and therefore, indirectly on income levels. | The employment figures are less detailed than in the “labour force / employment” tab. Training statistics should be cross-referenced with those on socio-professional categories and then analysed according to the positioning of your offer. |
| Taxable income | The taxable income is indicated according to the town. This is a particularly useful view to understand the dynamics of the area and easily identify positive or negative statistical errors. | If you find that one or the other town has an average taxable income that is very different from the others, do not hesitate to deepen your analysis in order to understand its origin. The housing tab proposes a low-income category that could highlight a higher number of low-income people. |
| Product-Specific consumption | This is a national statistic that gives you the volume of purchases for the whole of France over the last 5 years. These figures can be useful in understanding market dynamics over time. | It may be useful to start by looking at these figures before you even do your local implementation analysis. Indeed, if you notice a decrease in spending in your future market, it may not be a waste of time to think about the opportunity of creating your company in this sector. |
| Spending by age group | These figures will allow you to understand the sales dynamics of the product according to age (at the national level) and to verify at the local level that the most dynamic age group(s) are the most significant (population tab). | |
| Spending by household category | The analysis method is the same as for the age groups. First look at how spending is distributed according to household category and then check, at the local level, that the most “buying” household categories are well represented. | |
| Spending in accordance with the ZEAT | The study and land use planning area (ZEAT) corresponds to a division of France into 10 main areas: Paris region, North, East, West, South-West, Centre-East,… Expenditures are therefore presented here according to these major geographical areas, which makes it possible to visualise those that are the most active. | The figures provided are average expenditures. It is therefore easy to compare the different areas with each other and identify those that are most relevant to the creation of a business. |

![Illustration of our post "What do customers expect from downtown stores? [Survey]"](/blog/app/uploads/retail-shopping-covid19-120x90.jpg)