If you want to know everything there is to know about YouTube stats, this is the article for you. Research from 2023 takes an innovative technical approach to the most secret of YouTube stats.

70% of YouTube’s traffic depends on its recommendation algorithm. The videos to which each of us is exposed vary enormously. Our conception of YouTube as a space for media creation and storage needs to be more balanced. A highly original piece of research that provides a better understanding of YouTube has just been published. Thanks to an innovative sampling technique, it delivers unprecedented YouTube stats.
Contact us for all your online research needs (market research, surveys, etc.)
YouTube: the latest statistics
- 70% of YouTube traffic comes from its recommendation algorithms.
- At the end of 2022, the number of videos uploaded to YouTube was around 10 billion.
- The average number of views on YouTube videos is 5868. The median is 35
- 68%: the proportion of *videos with zero views
- 38%: the number of YouTube videos with fewer than 5 views
- 44%: the number of YouTube videos with fewer than 100 views
- 93%: the number of YouTube videos with less than 1000 views
- 34% of YouTube videos concern gaming
The difficulty of analyzing YouTube
YouTube is a platform that remains a mystery to those who would like to analyze it. It is “unfathomable,” as the authors put it, because, unlike Twitter, no connector (API) is provided to research its content. Therefore, the various researchers who have tackled the problem have had to proceed by sampling. On paper, this approach makes sense. But everything depends on the sampling technique and its ability to be representative.
This is the originality of the work published by 5 computer science researchers. They have exploited a “loophole” in how YouTube assigns URLs to uploaded videos (see article for more details). This probabilistic approach, which they called “Dialing for Videos,” enabled them to overcome the biases inherent in other methods previously used. This enabled them to obtain reliable statistics on the 10 billion videos on YouTube.
The authors also analyzed the content of the videos and attempted to use a language recognition algorithm to obtain even more information about the content.
YouTube is filling up exponentially with videos, most of which have yet to be seen by anyone and mainly concern video games.
Ethan Mollick, Wharton School, University of Pennsylvania
The exponential growth of YouTube videos
The first finding of the research concerns the number of videos on YouTube and their evolution over the years. YouTube doesn’t disclose this figure, so it must be estimated using roundabout methods.
Using statistical inference, the authors arrive at a figure of 9.881 billion by the end of 2022. At the time of writing, there are over 10 billion videos on YouTube.
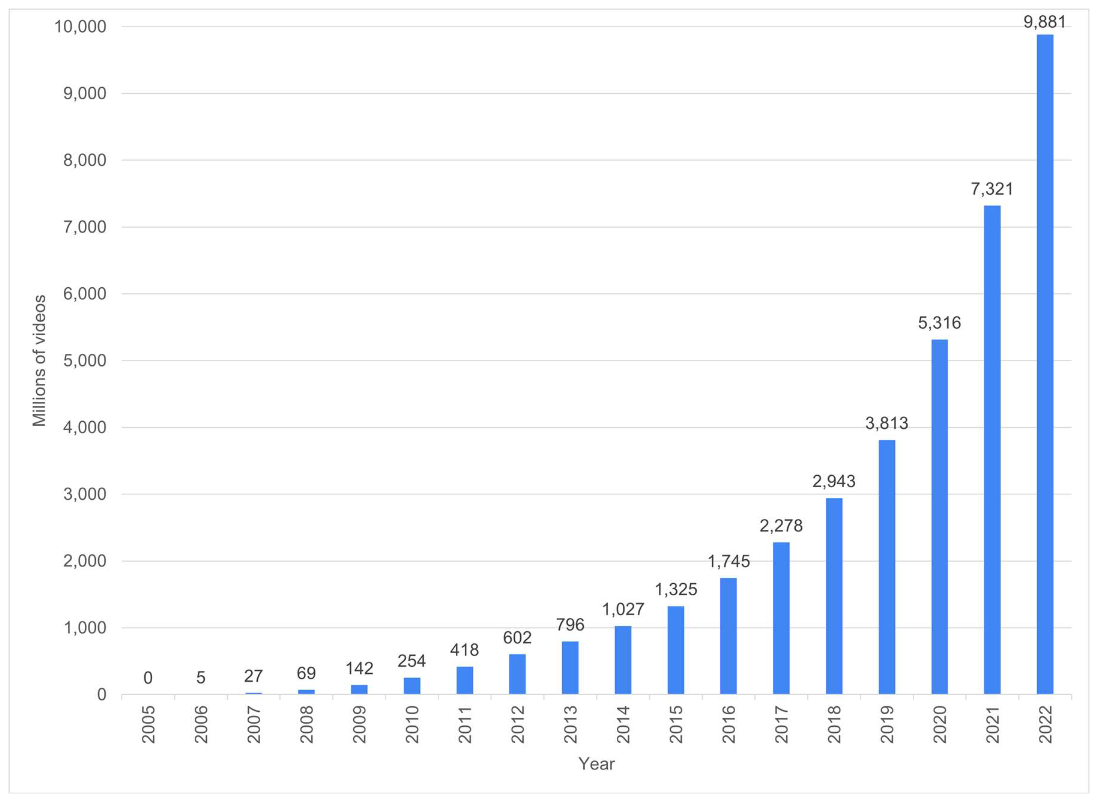
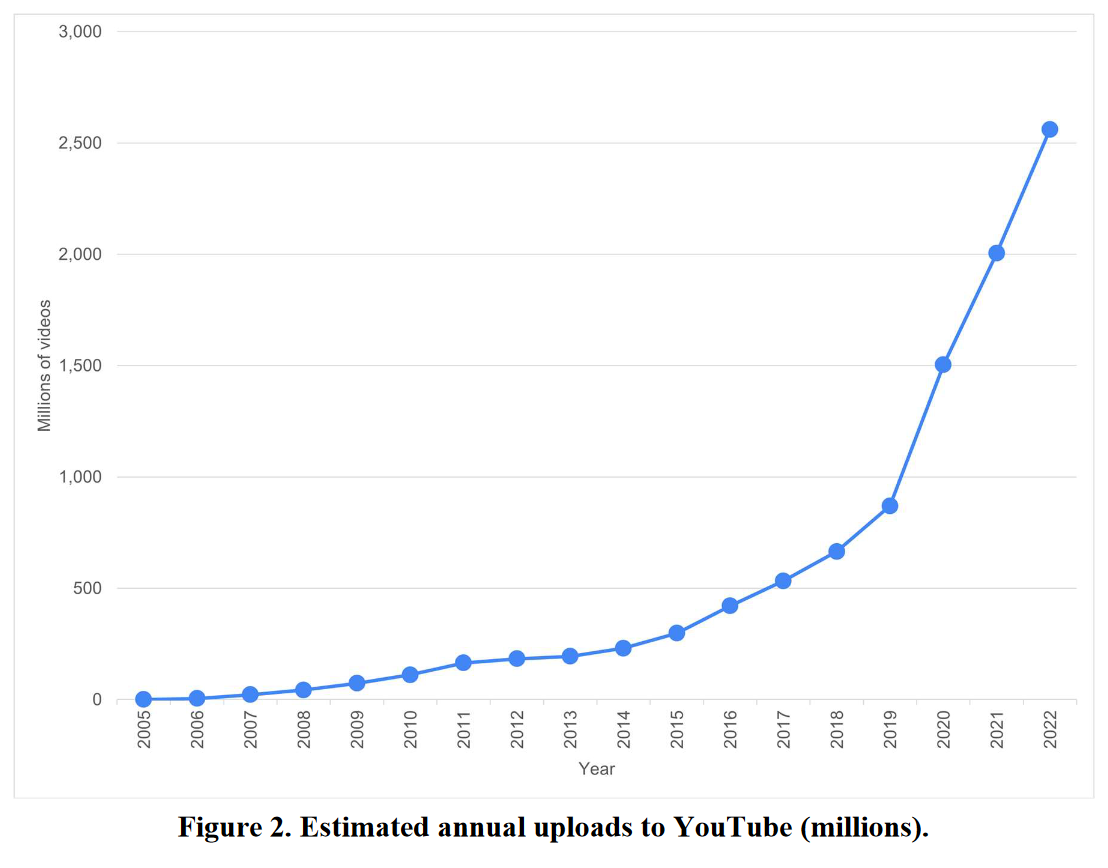
As you can see from the graph below, the evolution is exponential. Nearly 2.56 billion videos were uploaded to YouTube in 2022 (see graph below)!
The number of views, likes, and comments on YouTube
Of course, the overall statistics on views, likes, and comments are among the most interesting. Unsurprisingly, the results reveal a significant asymmetry. Whatever the indicator analyzed (views, likes, comments), the average and the median are far apart.
Number of views
The average number of views is 5868. The median is 35, meaning half of all YouTube videos have fewer than 35 views! A substantial number of videos (4.68%) have no views. The graph below shows the proportion of videos with fewer than 100 views. These represent 65.44% of all YouTube videos. Only 3.67% of videos reach 10,000 views, but they account for 93.61% of all views on YouTube. You read that right … 3.67% of YouTube videos account for 93.61% of views on the platform.

Likes, comments, and subscribers
The average number of likes on YouTube is 16.48, and the median is 0.
As for comments, a YouTube video garners an average of 5.32. This figure conceals wide disparities. 72.64% of YouTube videos have no comments at all. This disparity is also reflected in the number of subscribers. While the average number of subscribers in the sample researched was 55,100, the median was just 61. It’s easy to see that there’s a gulf between some exceedingly popular large YouTube channels and the majority of small ones with few or no subscribers. Around 10% of YouTube channels have no subscribers at all.
1/3 of YouTube videos concern gaming
The other finding of this research concerns the type of videos posted on YouTube. The authors looked at a sub-sample of 1,000 videos, using double coding to determine the nature of the video individually. This exercise revealed some significant surprises.
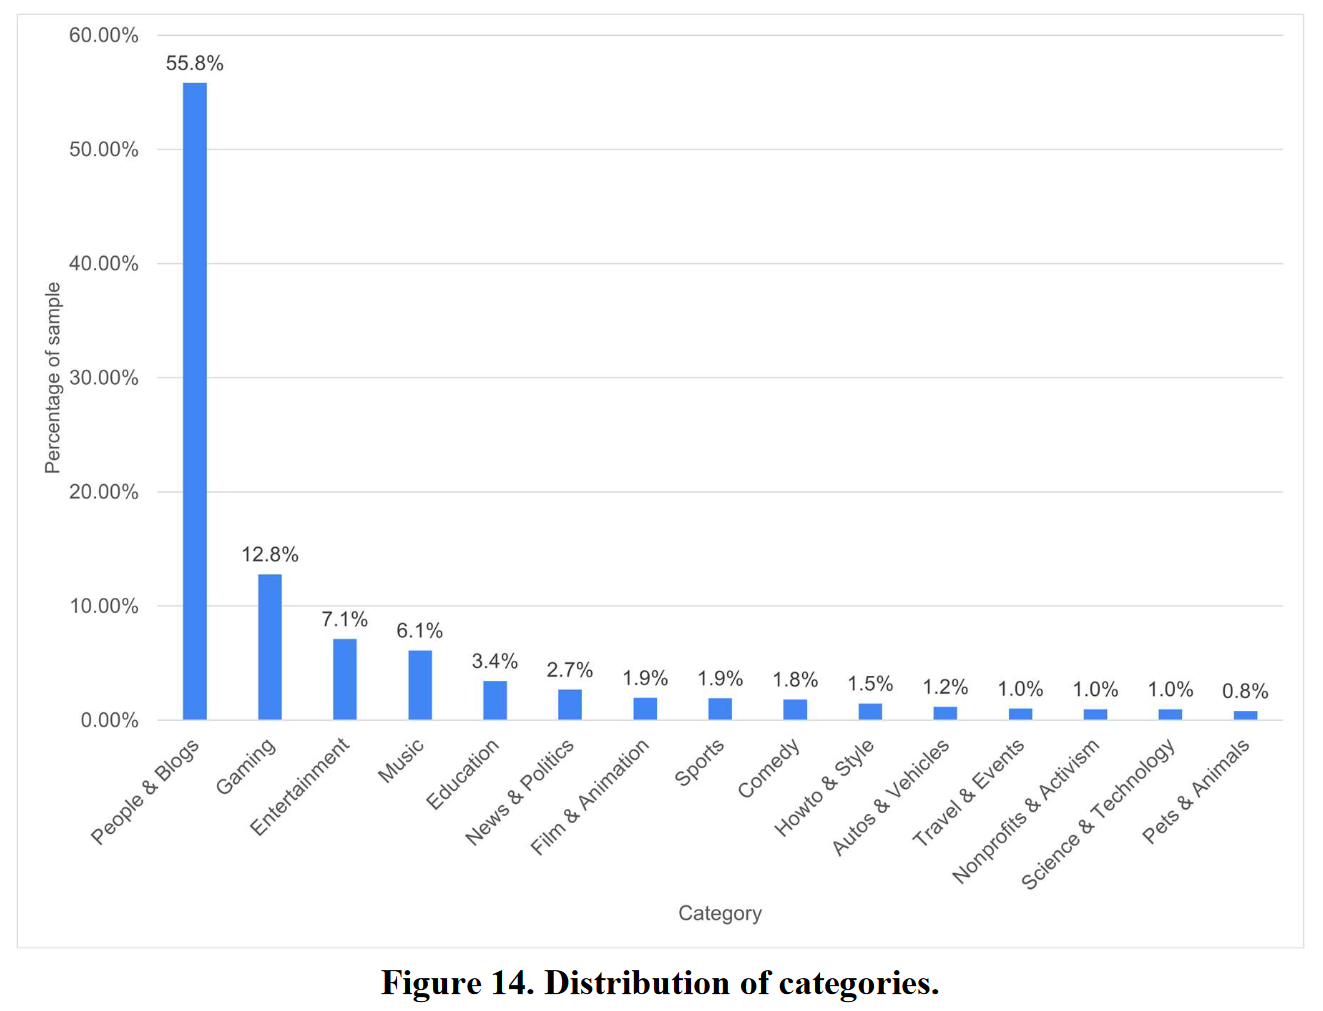
At first glance, this coding needs to be revised. After all, YouTube asks creators to choose a category when they put their videos online. This is declarative data; most creators (55.8%) chose the “People & Blogs” category.
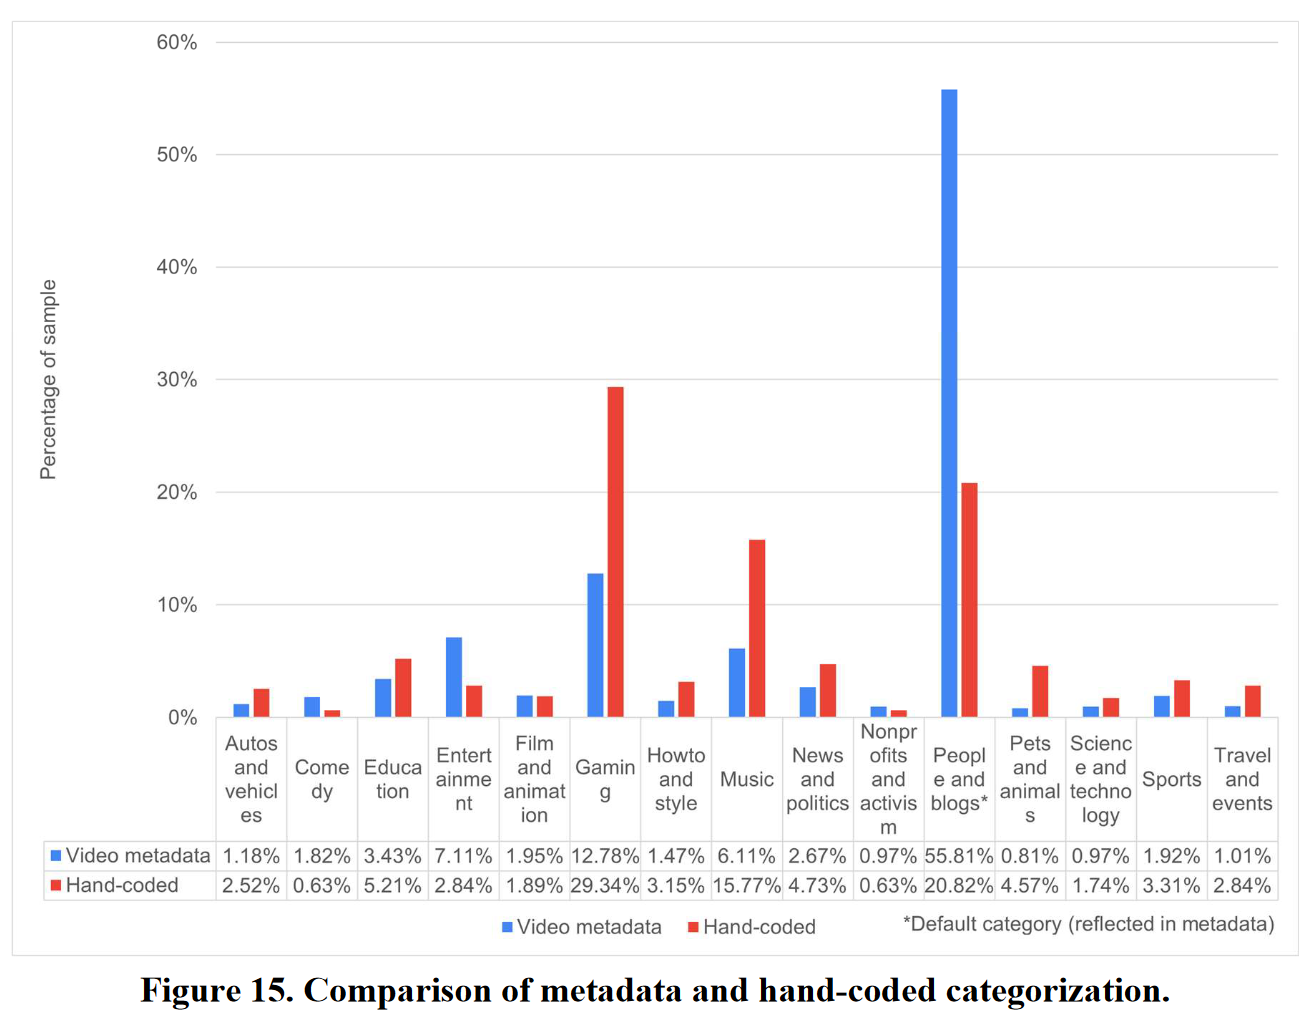
Individual analysis of the subsample of 1,000 videos showed that creators frequently chose the wrong category. These errors were particularly prevalent in the “gaming” category. Officially, this category only accounts for 12.78% of YouTube videos. In reality, however, it accounts for almost a third of videos (29.34%), as their creators incorrectly classify them under “People & Blogs.”
You can see the “real” distribution on the graph below. In blue are the “official” metadata; in red are those obtained after analysis of each video. The “Music” category is also subject to poor encoding for more than half the videos in this category.
Conclusion
The sampling technique known as “Dialing for Videos” offers a new gateway to YouTube. More specifically, “Dialing for Videos” provides a more detailed understanding of the nature of videos on YouTube, their number, and their most important metrics (views, likes, comments).
The results differ from previous research and offer new insights into video content. Almost a third (29.34%) of videos posted online are games, and 15% are music.
As academic Ethan Mollick aptly sums up, “YouTube is filling up exponentially with videos, most of which are not seen by anyone, and which mainly concern video games.”
Appendix: all YouTube stats
| Indicator | Average views |
| Median views | 5868 |
| Médiane des vues | 35 |
| Percentage of YouTube videos with no views 4,88% | 4,88% |
| Percentage of YouTube videos with one view | 4,44% |
| Percentage of YouTube videos with less than 100 views | 65,44% |
| Percentage of YouTube videos with less than 1000 views | 86,93% |
| Percentage of YouTube videos with more than 10,000 views | 3,67% |
| The average number of comments under YouTube videos | 5,32 |
| Percentage of YouTube videos with no comments | 72,64% |
| Percentage of YouTube videos with more than 100 comments | 1,04% |
| The average number of Likes under YouTube videos is | 16,48 |
| Percentage of YouTube videos with no likes | 88,71% |
| Average number of subscribers per YouTube channel | 55100 |
| Median number of subscribers per YouTube channel | 61 |
| Percentage of YouTube channels with at least 1 subscriber | 90,52% |
![Illustration of our post "Digitization: food & beverage industry companies lag far behind [Research]"](/blog/app/uploads/marche-alimentation-bio-long-120x90.jpg)