How to make a radial diagram using Tableau? How to integrate a pie chart? In this article, I guide you step by step in the realization of this data visualization.

Introduction
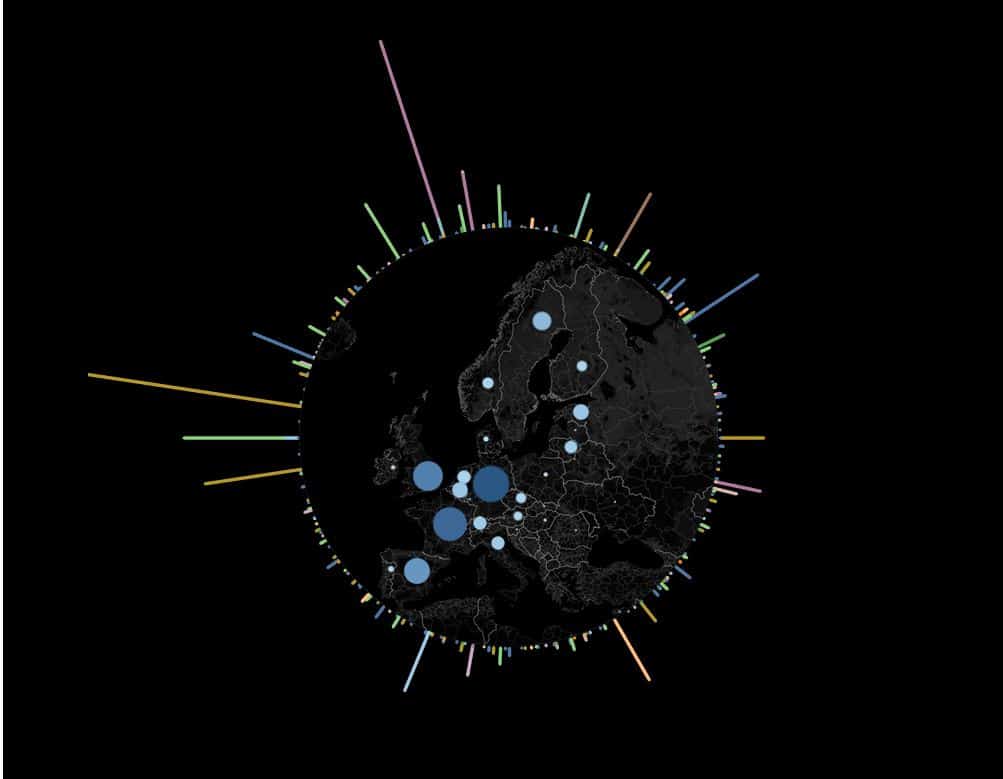
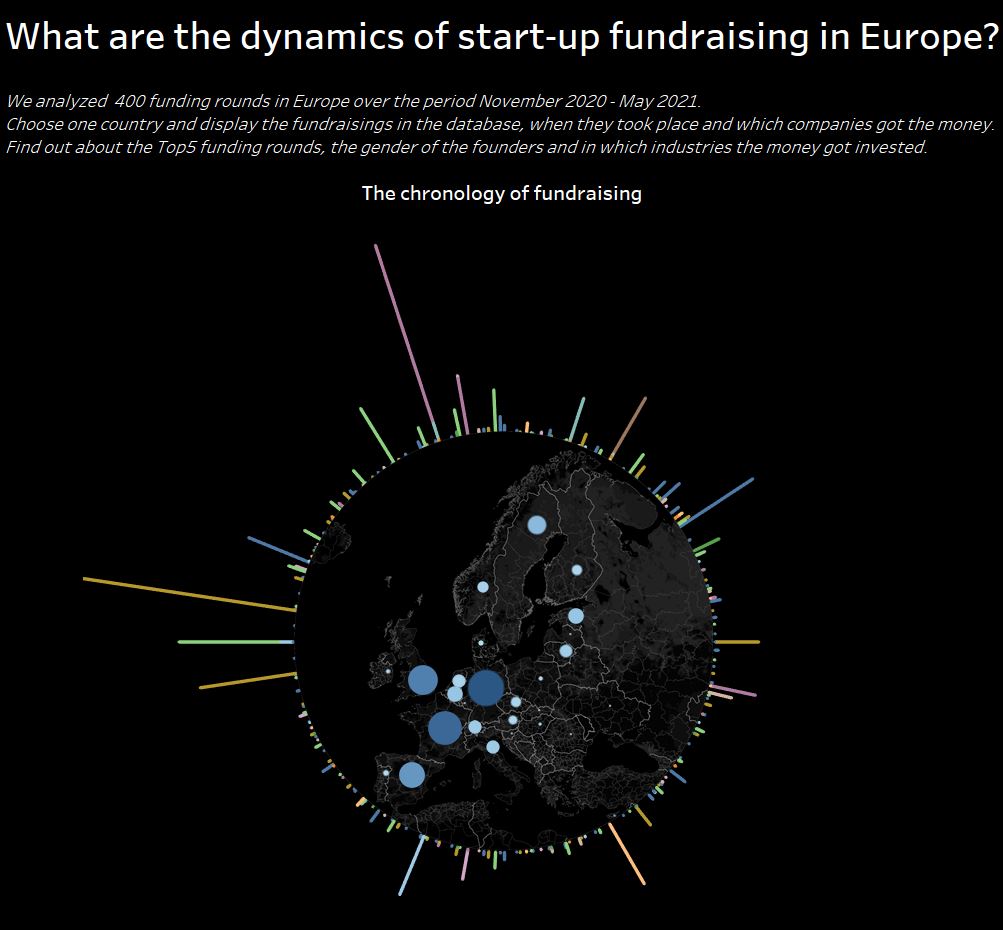
For my subsequent research on fundraising in Europe, I wanted to test a data visualization in the form of a radial diagram. To get an even more exciting result, I integrated an interactive pie chart in its center.
You will find 2 parts in this Tableau tutorial. The first one is dedicated to the realization using the radial diagram, the second one to create the pie chart. Each piece is illustrated with a small video. You can find the complete visualization on my public Tableau profile.
How to make a radial diagram using Tableau?
The use of a radial diagram makes sense when you have a succession of data in time or distance. The circle allows you to represent a chronology or a path.
In my case, I wanted to represent a chronology: that of fundraising in Europe.
Many websites go into detail about the parametric equations used. Rather than repeating the same thing for the umpteenth time, I prefer to refer you to this website.
If you want to test the circular radial diagram quickly, you can copy the formulas below.
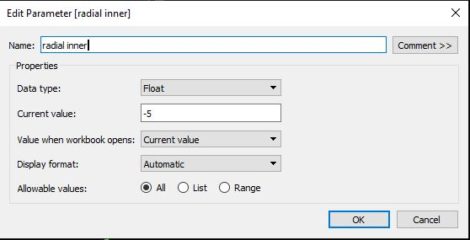
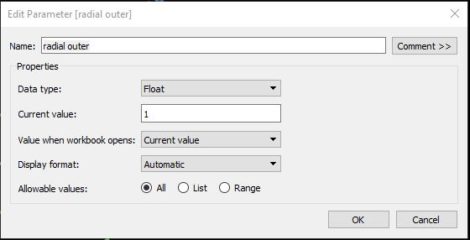
The 2 parameters
Firstly, you will need to create 2 parameters.
The fields calculated for the radial diagram
Below are the formulas to copy for the different calculated fields. Make sure to create them in the order shown below
Path Order
IF [Vizside] = "Feuille 1" THEN 0 ELSE 1 END
You will have to replace “Sheet 1” with the name of the corresponding field (see video for more details).
“Path Order” should be changed to “dimensions” using Tableau.
Radial Field
[montant de la levée de fond]
Replace the “amount of the fundraising” variable with the one you wish to visualize. This variable is the one that will define the height of the bars in the radial diagram.
Radial Angle
(INDEX()-1)*(1/WINDOW_COUNT(COUNT([radial field])))*2*PI()
Radial normalized length
[radial inner] + IIF(ATTR([Path Order]) = 0, 0, sum([radial field])/WINDOW_MAX(sum([radial field])) * ([radial inner]-[radial outer]))
Radial X
[radial normalized length]*COS([radial angle])
Radial Y
[radial normalized length]*SIN([radial angle])
You may need to adjust the min and max values of the y-axis and x-axis so that the diagram is circular and not elliptical.
How to create a pie chart using Tableau?
In the first version of my data visualization, I used a rectangular map. Even with a dark background (“dark mode” in Tableau), the result was average. So, I looked for solutions to get a better result.
Step 1: preparation of the transparent map
To prepare the transparent map, I first took a screenshot of the map background using Tableau. I used a circular selection tool in Photoshop to cut out the part of the map that interested me. I then adjusted the contrast to make the borders stand out better.
Step 2: Adding the transparency
I then pasted the circular cut-out part on a white background. Using this website, you can easily convert the white pixels into transparent pixels.
Step 3: duplicating the map using Tableau
To make the map interactive, I followed the solution proposed on this website. I duplicated my initial map and removed all the background elements. The interactive features can then be superimposed on the map created in Photoshop. Of course, you should not forget to lock the zoom and move options. You can then activate the map filter to select the country you are interested in directly.


![Illustration of our post "Free Generative AI Detectors: Which Ones to Choose? [Complete Test 2025]"](/blog/app/uploads/sherlock-holmes-120x90.webp)