Update : 26 juin 2023
How has the number of complaints about personal data changed since the GDPR came into force? We will answer this complex question with unique data, published for the first time. These data were collected directly from the data protection authorities of each European country. As no global studies were available, this data collection process took us nearly ten months.
We will reveal the complaint rate in each country and the evolution, between 2017 and 2018, of complaints relating to the protection of personal data. There will be many surprises.
We make the results available free of charge to everyone on our Tableau Public workspace. You are free to reuse them on the express condition that you mention the source (“IntoTheMinds marketing agency“) and make a hyperlink to this article.
Contact IntoTheMinds market research agency
Results of the IntoTheMinds study on the effects of the GDPR in the European Union between 2017 and 2018
- 25 Countries studied
- 86%: the average increase between 2017 and 2018 in complaints related to the protection of personal data
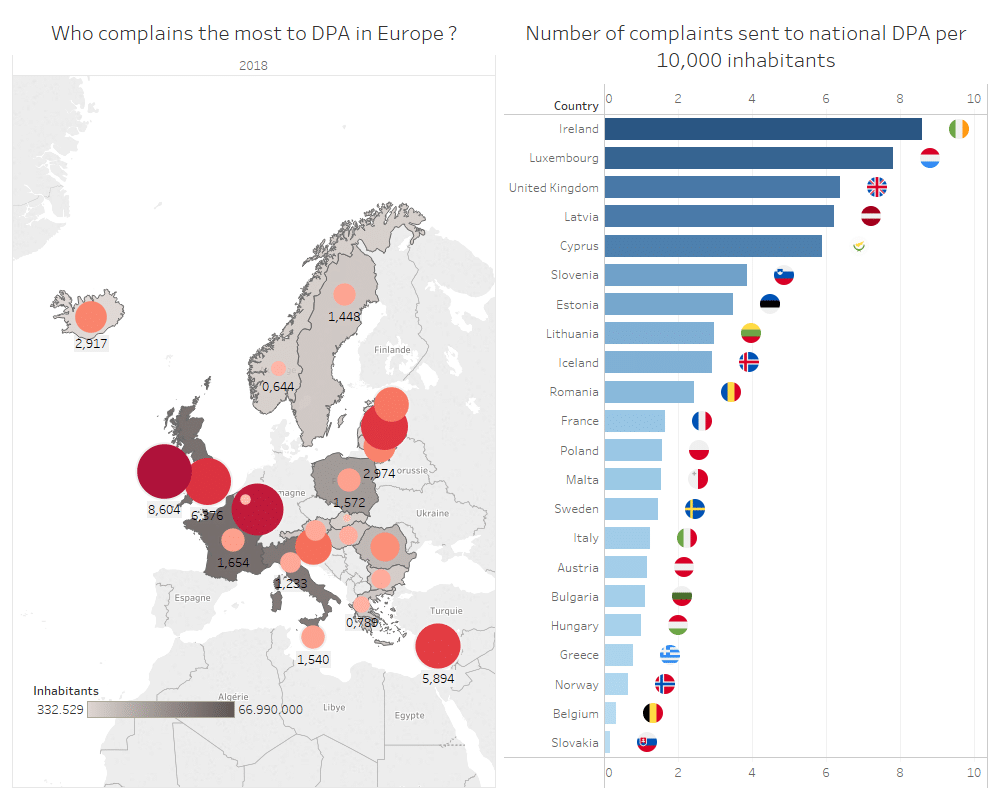
- 3 complaints per 10,000 inhabitants on average in 2018
- 2x : Doubling of the number of complaints per capita between 2017 and 2018
- Slovaks are the least complaining (0.17 complaints per 10,000 inhabitants)
- The Irish are the most complaining (8.6 complaints per 10,000 inhabitants)
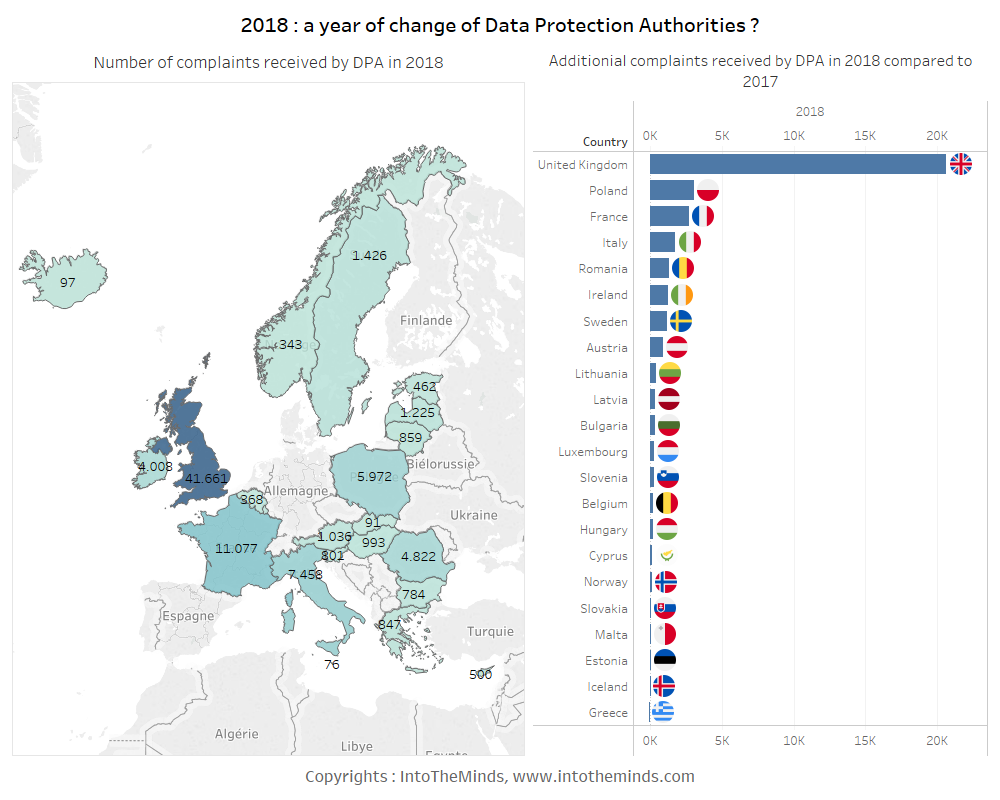
- +20462: the increase in the number of complaints in the United Kingdom
- Iceland and Greece are the only countries with fewer complaints in 2018 than in 2017
Table of contents
- An increased awareness of the importance of personal data
- A steadily increasing collection of personal data worldwide
- The expected effects of the GDPR
- Methodology
- Results
Users are increasingly aware of the importance of personal data but …
Consumers are increasingly aware of the importance of their data. Repeated scandals (Cambridge Analytica,…) are there to raise their awareness of personal data protection issues. The multiplication of connected devices and the digitisation of our lives are converging towards an ever more massive collection of personal data and increased protection problems. Even with the multiplication of regulations relating to the protection of personal data ( GDPR and soon e-privacy in Europe,) the challenges are immense. Indeed, most users do not read privacy policies, and the websites designed in such a way as to direct the user’s behaviour “nudge them” towards consent. More significant, better placed, more colourful acceptance buttons, kilometric privacy policies, all strategies are useful to prevent the user from asking too many questions. And it works! 56% of Internet users accept the terms of use of the sites without reading them (source). I said in a prophetic post published after the Cambridge Analytica affair that everything was the user’s fault.
56% of Internet users accept the terms of use of the sites without reading them
Take a look at the list of the most visited sites in the world to find striking examples of “manipulation” of consent. The Allrecipes.com site (more than 40m visitors per month) is a model of its kind. A privacy policy that crosses the entire screen and a single button (“Continue”) in a bold colour to accept.
Some figures
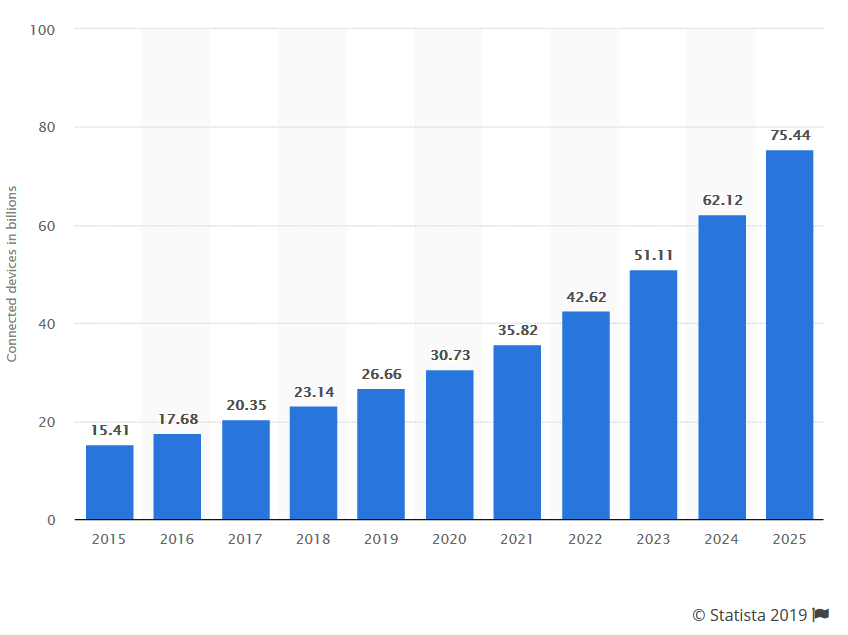
By 2025, an estimated 75 billion devices will have an Internet connection (compared to 25 billion in 2019). This growth illustrated in the graph below will lead to more and more personal data connected.
In particular, growth in the connected wristband market is forecast at 19.6% over the 2017-2023 period. This market is expected to quadruple in value over the next six years (to reach nearly $70 billion). It is, therefore, not surprising that Google bought Fitbit for $2.1 billion. But you understand that the concentration of such sensitive data (your daily activities, your heart rate,) within a single conglomerate is not likely to reassure users.
The number of connected devices will increase threefold between 2019 and 2025
The problem of personal data protection can, therefore, only increase and the legislator will have to follow. We are consequently lead to examine pioneering legislation and its effects: the GDPR (General Data Protection Regulation).
Expected effects of the GDPR on the number of complaints
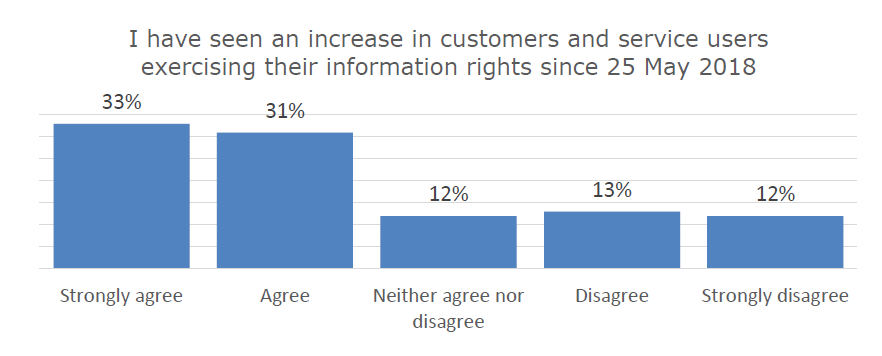
Specific results on the effects of the GDPR on user behaviour are limited. Instead, it is the fines that will receive media coverage, but few people are interested in the relationship between the GDPR and personal data protection awareness. Yet in some countries, it would appear that the GDPR is effective. In the United Kingdom, for example, the ICO (Data Protection Authority) published in its 2018/2019 report the results of a survey of English DPOs (Data Protection Officers). 64% report that they have seen an increase in the number of requests from users after the introduction of the GDPR (see results below).
I undertook the exercise the day after the GDPR became valid, with, admittedly, poor results.
64% of English DPOs noted an increase in the number of requests after the introduction of the GDPR
It remained to be seen whether this impression reported by the English DPOs was accurate regarding the figures and whether it could be generalised to all European countries.
Methodology
Figures on the number of complaints about personal data are not readily available. For example, they are not systematically published. We had to contact the protection authorities of each country individually. We asked them for statistics on complaints received by their services for at least the last three years (2016, 2017, 2018). The year 2018 was a transitional year as the GDPR came into effect on May 25, 2018. 39% of the year 2018 was therefore spent under the old legislation (pre-GDPR) and 61% under the new one. To circumvent this problem, we also requested monthly figures. The latter is, in theory, better witnesses of consumer reaction to the introduction of the GDPR.
We sent our first requests to the data protection authorities of each country in May 2019. Reminders were sent in June 2019 and then every month from September 2019.
We did not send a request to the CNIL because the annual data were available on the government open data website. For all other countries, we have sent a request, either by email or via the contact form. Below is a list of the data protection authorities contacted.
List of national data protection authorities and contact details
- Germany: Die Bundesbeauftragte für den Datenschutz und die Informationsfreiheit
- Austria: Österreichische Datenschutzbehörde
- Belgium: Autorité de protection des données
- Bulgaria: Commission for Personal Data Protection
- Cyprus: Commissioner for Personal Data Protection
- Croatia: Croatian Personal Data Protection Agency
- Denmark: Datatilsynet
- Spain: Agencia de Protección de Datos
- Estonia: Andmekaitse Inspektsioon
- Finland: Office of the Data Protection Ombudsman
- France: Commission Nationale de l’Informatique et des Libertés
- Greece: Hellenic Data Protection Authority
- Hungary: Data Protection Commissioner of Hungary
- Ireland: Data Protection Commissioner
- Iceland: Data Protection Commissioner
- Italy: Garante per la protezione dei dati personali
- Latvia: Data State Inspectorate
- Liechtenstein: Data Protection Office
- Lithuania: State Data Protection
- Luxemburg: Commission Nationale pour la Protection des Données
- Malta: Office of the Data Protection Commissioner
- Norway: Datatilsynet
- Poland: The Bureau of the Inspector General for the Protection of Personal Data
- Netherlands: Autoriteit Persoonsgegevens
- Portugal: Comissão Nacional de Protecção de Dados
- Czech Republic: The Office for Personal Data Protection
- Romania: The National Supervisory Authority for Personal Data Processing
- United Kingdom: The Information Commissioner’s Office
- Slovakia: Office for Personal Data Protection of the Slovak Republic
- Slovenia: Information Commissioner
- Sweden: Datainspektionen
Number of answers received
We contacted 30 countries. For France, data were already available. As of December 7th 2019, 22 countries had replied: Iceland, Croatia, Slovakia, Latvia, Cyprus, United Kingdom, Poland, Norway, Denmark, Lithuania, Romania, Luxembourg, Sweden, Ireland, Liechtenstein, Hungary, Slovenia, Bulgaria, Malta, Greece and Finland.
Lithuania and Ireland provided monthly statistics. Belgium provided monthly data only for 2018. All the other countries provided monthly results.
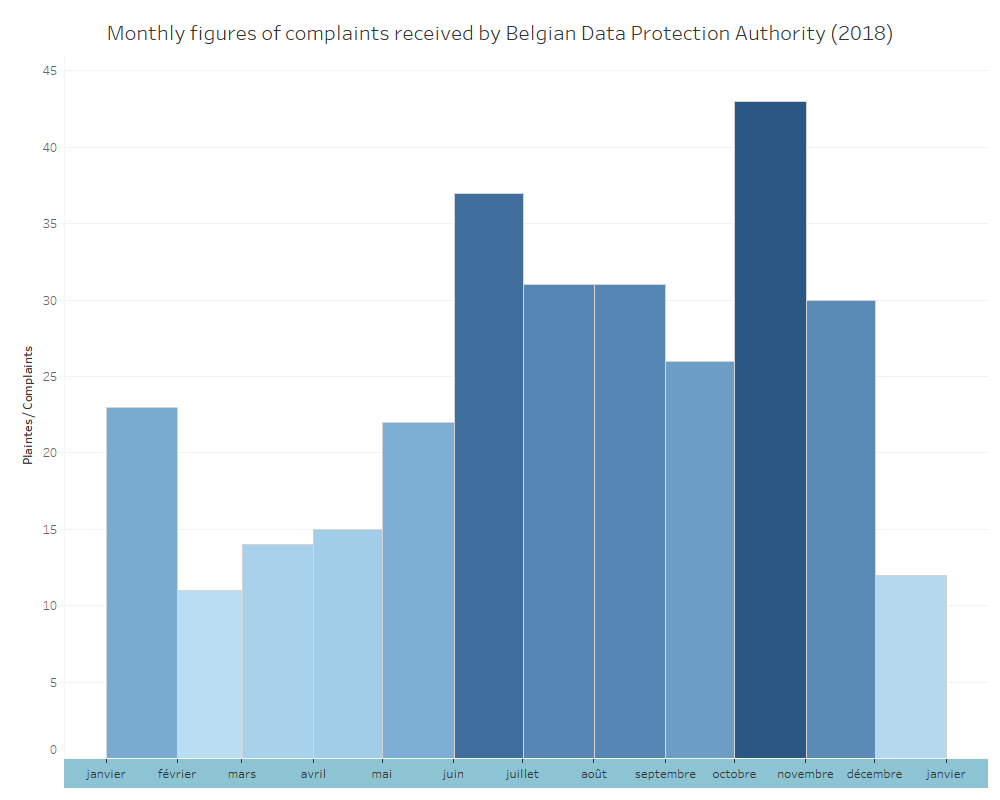
Monthly evolution of complaints received by the Belgian Data Protection Authority
The graph shows the monthly evolution in 2018 of the number of complaints (“mediations”) received by the Belgian Data Protection Authority. While an increase is perceptible after May 2018, it remains completely marginal.
Exploitation of the results
All the results received are usable except those sent by Liechtenstein, Croatia, Finland and Denmark. For Belgium, we have made a reconciliation of data from 2 sources.
In Liechtenstein, the GDPR entered into force on July 20, 2018, and the previous legislation was not comparable. The Liechtenstein Protection Authority, therefore, sent statistics on requests for information and not on complaints. These figures are not comparable with those provided by other protection authorities.
The problem is the same in Finland; the Finnish Data Protection Authority did not wish to provide us with figures before 2018. We therefore only know that for 2018, 297 complaints were received by the Finnish DPA. We will therefore only be able to monitor the evolution of complaints in this country from 2020 onwards when we receive the figures for 2019.
For Denmark and Croatia, the figures provided combine requests for information and complaints. The data cannot, therefore, be used to calculate the number of complaints per inhabitant. However, we have kept these figures to show an increase between 2017 and 2018.
For Belgium, the data concerning complaints are not communicated by the calendar year. Fortunately, the 2018 annual report of the Belgian Data Protection Authority contains statistics on the evolution of the number of complaints per quarter. We, therefore, reconstructed a volume of complaints by adding the “mediation” data from the various annual reports (2017 report, 2016 report).
Results of the study
The results of the study are proposed around three areas of analysis:
- the evolution of the number of complaints (in %) between 2017 and 2018
- the evolution of the number of complaints (in absolute figures) between 2017 and 2018
- the number of complaints relating to personal data per 10,000 inhabitants
You are free to reuse these results on the express condition that you cite the source (“IntoTheMinds marketing agency“) and make a hyperlink to this article. For the sake of transparency, we also provide you with all the raw figures in the pdf file below. You can also download the data source and the visualisation file directly from our Tableau Public workspace.
plaintes privacy europe GDPR 2016-2018 version 20191207Relative evolution of the number of complaints in Europe following the entry into force of the GDPR
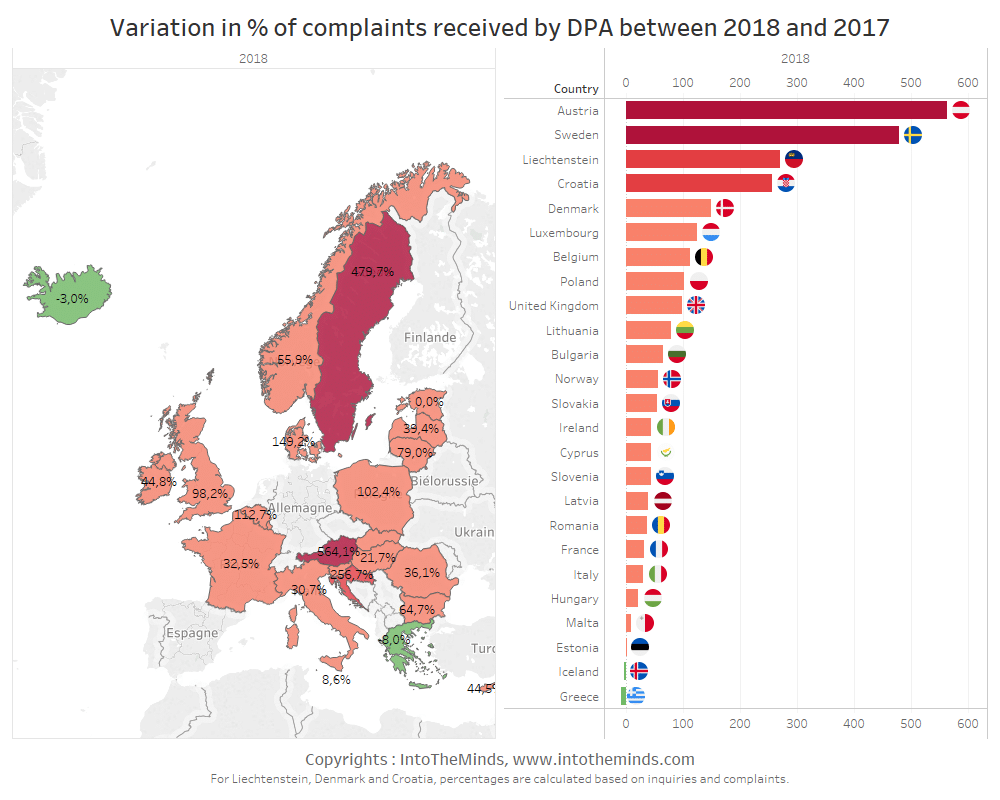
Except for Iceland (-3%) and Greece (-8%), all European Union countries show, after the entry into force of the GDPR, a very marked increase in the number of procedures initiated by citizens. The protection of personal data, therefore, seems to concern individuals. The average increase is 86% for the countries studied (including those for which available statistics combine information requests and complaints). The increase is 480% in Sweden and exceeds 550% in Austria (update 04 May 2020 received from the Austrian DPA, more than 1 year after my initial request).
Absolute evolution of the number of complaints in Europe following the entry into force of the GDPR
In absolute terms, the change in the number of complaints after the introduction of the GDPR is less impressive than the percentages suggested. The average increase is 1899 complaints, a relatively low level compared to the number of inhabitants concerned. The most visible increase was in the United Kingdom (+20462 complaints). If we remove the United Kingdom, the average rise in GDPR complaints between 2017 and 2018 is only 727. The illustration below shows the increases by country in the form of histograms as well as a map.
Rate of complaints concerning personal data in the countries of the European Union
To put the previous results into perspective, it is necessary to reduce the levels of complaints to the number of inhabitants in each country of the European Union. It is not logical to compare the volumes of complaints in the United Kingdom with those in a country like Iceland. This is what we have done in the following analysis. You can see that the complaint rate per 10,000 inhabitants is relatively heterogeneous. Slovakia and Belgium have the lowest complaint rates (0.17 and 0.32 per 10,000 inhabitants, respectively). Ireland has the highest rate (8.6). The average rate is 2.99 per 10000 inhabitants.

