If you think about maps you’ll most probably have in your mind the image of a geographic map, depicting the borders of a country or of a group of countries. There are however numerous other types of maps that are much more interesting and that can be of great help in your market research and your business plan.
Geographer Jacques Levy recently published a book where he uses 30 astonishing socio-economic maps created by Luc Guillemot, a PhD candidate at Ecole Polytechnique Federale de Lausanne (EFPL).
Guillemot already worked with J. Levy on other election-related projects. For instance Guillemot produced a map during the 2012 US elections showing the correlation between the votes and density of inhabitants. Levy and Guillemot explain:
The usual mapping of the U.S. presidential election may be misleading. Dividing the space at the State level it gives the image of a territorial division among twenty-six states (plus the District of Columbia) for Barack Obama and twenty-four for Mitt Romney. If you go down to the county level (there are more than 3,000 in the United States, which makes an average of 100,000 inhabitants per county), other spatial configurations appear. If, however, surfaces are no longer represented such as on conventional maps but inhabitants, a more realistic picture of USA is obtained. This is what offers the following “cartogram”. It shows that Obama confirms his geography of 2008: a strong network-based vote against a Republican minority relying on territories.
Similar maps were produced during the 2012 French elections to show the same types of correlations in the Hollande-Sarkozy Grand Final.
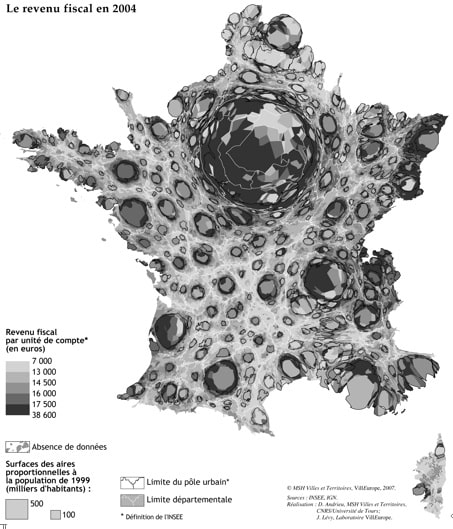
If you still don’t see what can be done with this kind of maps, have a look at the map above showing the how average revenues are spread across the French territory. As you can see such map can be extremely useful when you need to decide where to settle a store, in which part of a country to deploy your marketing strategy first, how to deploy it, …
In Levy’s book you’ll find other inspiring examples and a whole reflection about how territorial divisions decided centuries ago may give a distorted view of the reality. Levy proposes a fresh new wind on the Science of geography and how it can contribute to modern times and current problems.
Advice for your market research and your business plan
Geography maps have existed for centuries and all look alike. An innovative concept applied to this “object” allowed Levy to create a fully different perspective that changes completely the very purpose of the map. More importantly however the maps created by Levy also constitute new tools for marketers to decide on the best strategies to apply, the territories to conquer, and so on.
While writing your business plan and/or researching the market, look for such maps and learn from them. They can be considered a trustworthy source of information and should be positively appreciated by banks when deciding over a loan for your startup.
Posted in Marketing, Research.