Two weeks ago we dealt with the previsions of bankruptcies in Europe and more particularly in Belgium. We said that the number of bankruptcies will keep increasing in Belgium to reach 11500 firms’ failures by the end of 2014. This figure should however be compared to firms’ creation figures. This is what we do here.
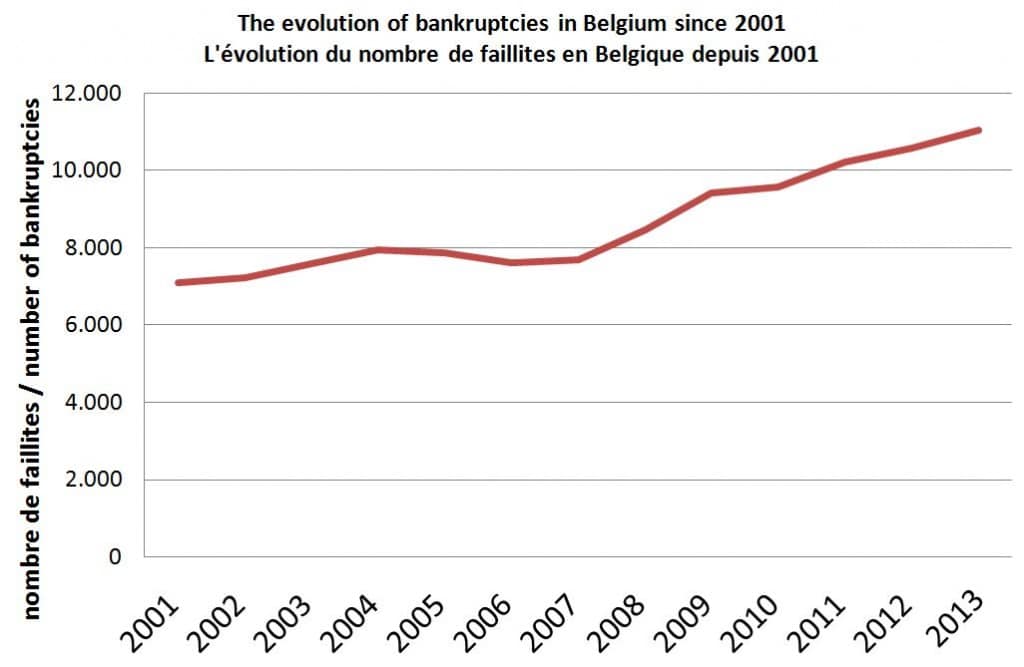
The number of bankruptcies increases …
One thing is clear from the graph below, the number of bankruptcies has increased 55% between 2001 and 2013.
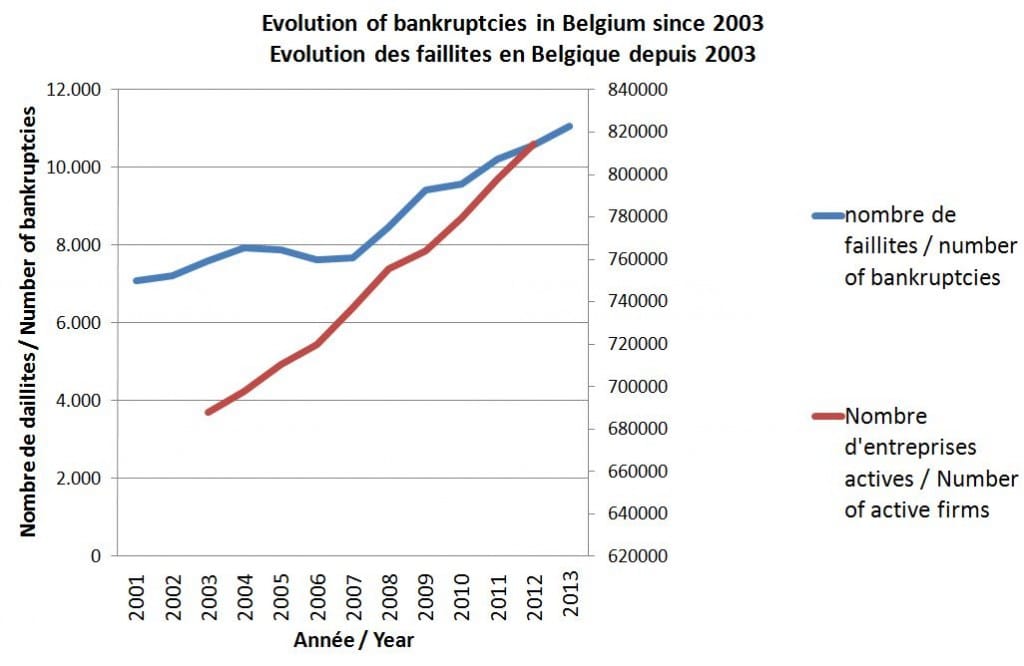
… so does the number of active firms
Rather than taking absolute values into account one should always try to understand the underlying aspects of any given situation.
This is what we try to do here by putting in contrast the number of active firms in Belgium. One of the reasons the number of bankruptcy increases may be that the number of firms also increases in the same proportion.
What we see from the second graph is that the number of active firms does increase also very sharply. It has followed actually a constant increase since 2003 (the first year the data is available in StatBel)
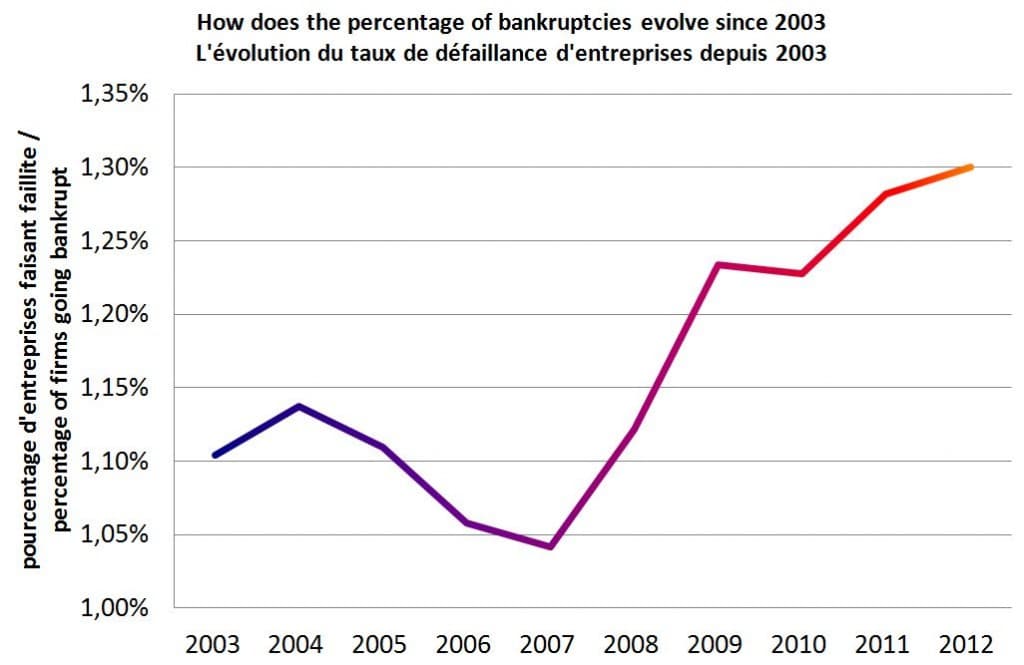
The ratio of bankrupted firms takes up in 2007
The situation becomes much more interesting to study when the ratio of firms going bankrupt is calculated (number of bankruptcies divided by number of active firms). What you see here is that the year 2007 marks the start of a negative cycle. Whereas the slope tends to decrease, the percentages have reached an all-time high in 2012 with some 1,3% of firms going bankrupt.
Posted in Entrepreneurship, Research.