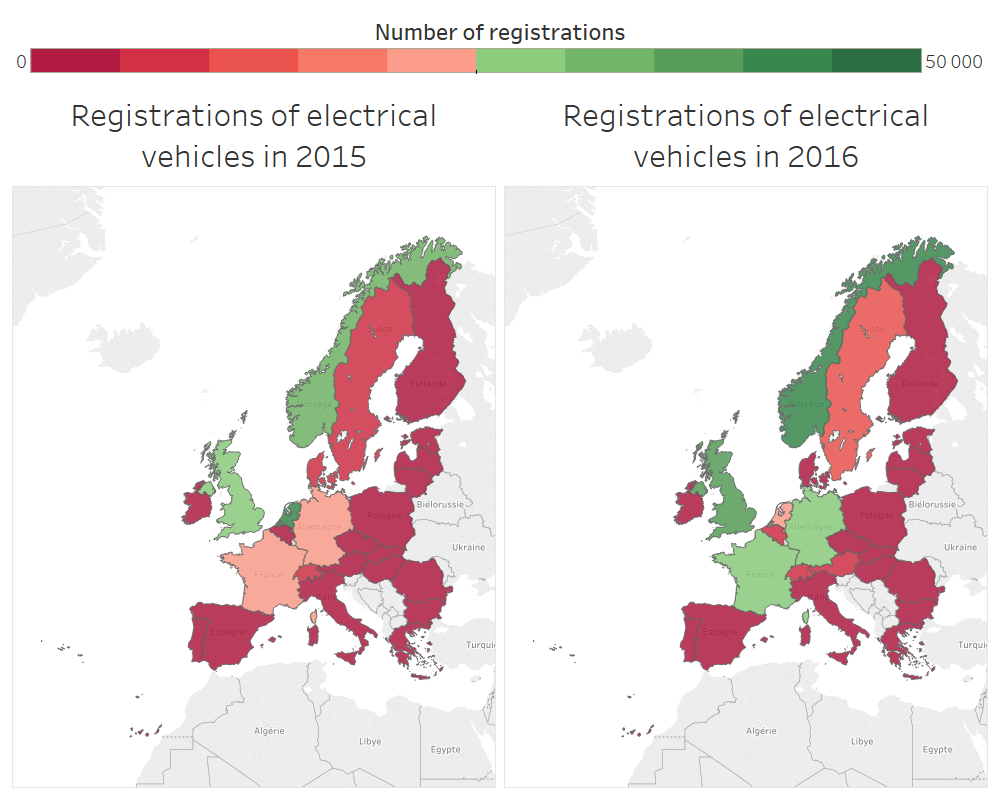
The European Automobile Manufacturers Association (ACEA) released recently an interactive maps that presents the state of the market for electric vehicles in the European Union. The figures presented refer to Electric-Chargeable Vehicles (ECV’s) sold in Europe in 2016.
The numbers remain fairly low, even negligible in most countries. Yet there are some striking differences from one country to the other.
- The TOP 3 countries with the highest share of electric cars are Norway with a whooping 29% of car registrations, The Netherlands (6%) and Sweden (3.6%)
- The BOTTOM 3 countries with the lowest share of electric cars are Bulgaria, Greece and Estonia. In those countries less than 40 electric cars got sold in 2016
The ACEA concludes that the sales of electric cars is correlated to the GDP per capita (at least the title of the web page “Interactive map: Correlation between uptake of electric cars and GDP in the EU” tends to lead to that conclusion). Norway which its share of 29% of ECV’s and “its GDP of €64,000 (almost twice the EU average)” seems to be the illustration of this.
But does that hypothetical correlation really hold ? Luxembourg is not mapped. Yet it has a very high GDP per capita (111000$ in 2016) and the hypothesis is likely not to hold for that small country. Moreover it seems to me rather adventurous to propose an hypotheis like this based on only a few years of historical data knowing that political decisions (especially incentives for buying electric cars) are likely to produce their effects years later.
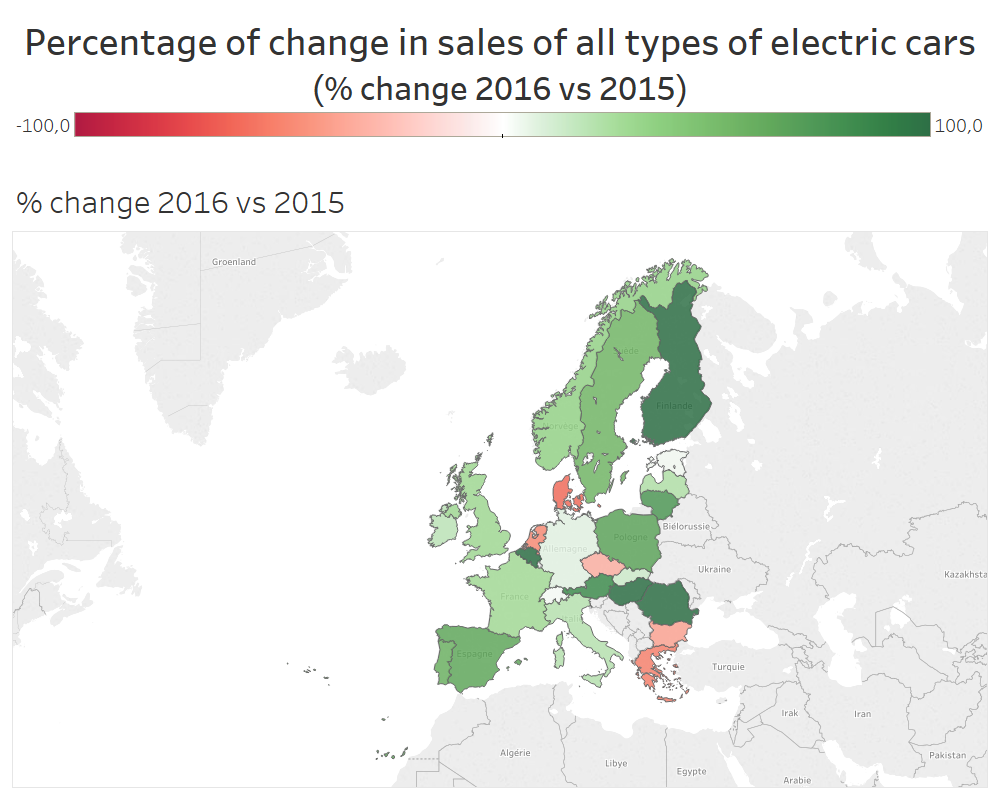
I quickly visualized the data of all types of electrical vehicles (not just plug-in vehicles) in Tableau Software for those intetested. You’ll see that Norway and UK remained the leaders in 2015 and 2016. In 2016 France and Germany made huge efforts.
Curiously Sweden and Finland are far behind their Norwegian counterparts although I had expected that the 3 nordic countries would display best-in-class practices.
Posted in Marketing.

