Visualizing data has become a standard task and one essential component of data science today. But, haven’t we forgotten how lucky we are to have all that data available and to be able to use it for various purposes ?
An early example of Big Data and visualisation project
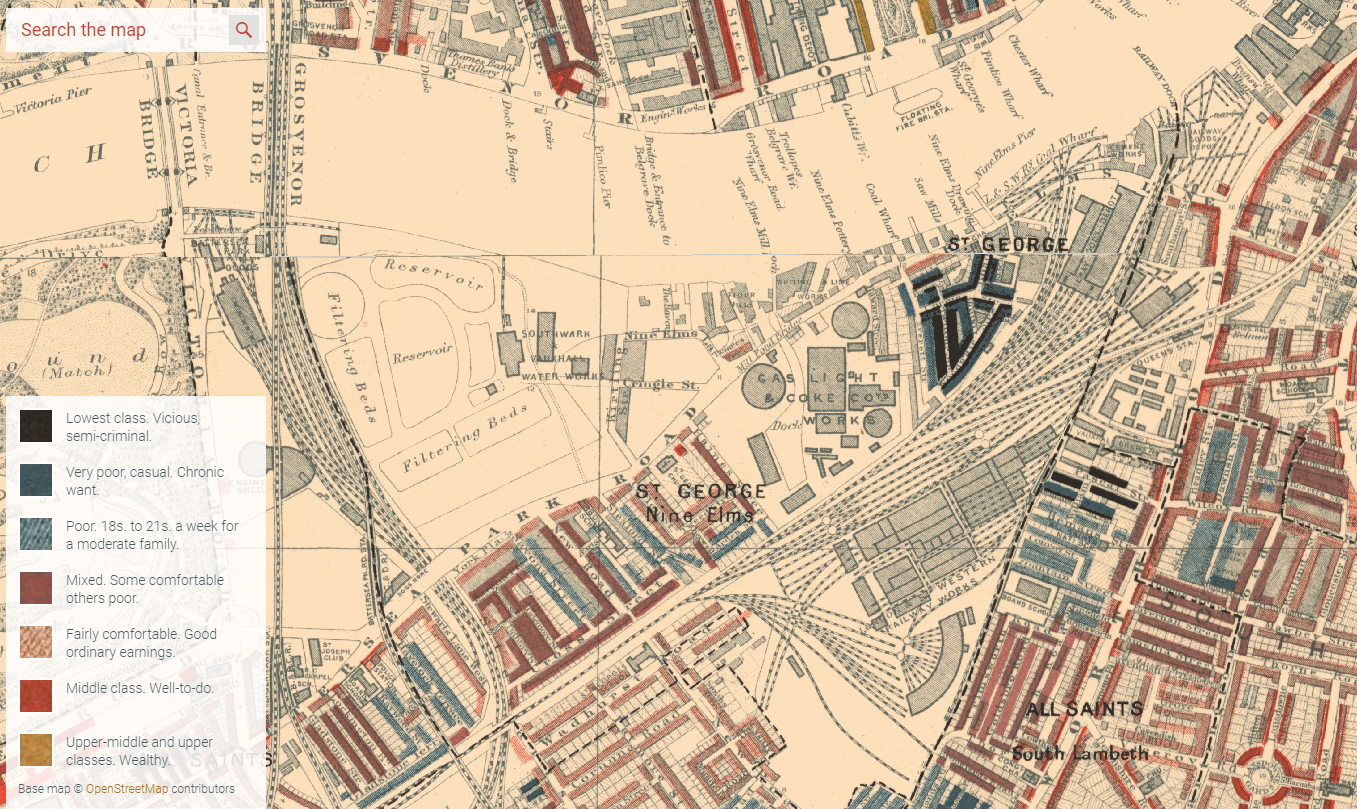
One of the most stunning visualization projects I’ve come to know was initiated more than a century ago by Charles Booth, a Liverpool-born businessman who became rich through trades with Brazil. Booth had a passion for statistics and was also a man of convictions, a.o. for societal issues like poverty. When he moved to London he was stunned by the level of poverty in some neighbourhood of the city and decided to produce a social cartography of poverty in London. He worked with census data and used his own money to finance a data collection project in whole London. Accompanied by policemen, he and his crew of researchers visited every house of London, interviewed inhabitants and eventually categorized them in 7 classes : from “lowest class. Vicious, semi-criminal” to “Upper-middle and upper classes. Wealthy.”.
The qualitative methodology used by Booth is described on the London School of Economics website as follows :
The survey methodology was complex and original, as befitted such an ambitious exercise of empirical research. Booth attempted to understand the lives of Londoners through a tripartite investigation of their places of work and working conditions, their homes and the urban environments in which they lived, and through the religious life of the city. Investigators accompanied London School Board visitors, and policemen on their beats. They interviewed factory owners, workers and trade union representatives at their places of work or in their homes. They visited ministers of religion and their congregations. The notebooks record the comments of interviewees and investigators and gathered data which was then used to generate statistical evidence of the living and working conditions of Londoners.
A particular outstanding tribute to ethnography was the use of this “tripartite investigation” method. Today we would speak of triangulation, of market research techniques trying to understand a phenomenon from different perspectives. I think this is the essence of good market research : combining methods and perspectives to assess a situation as objectively as possible.
A perfect market research example
This market research project remains today a unique early example of ethnography combined to quantitative research. The London School of Economics (LSE) preserves this heritage and makes ethnographic notebooks and maps available on this website. The first coloured map was published in 1889 and was followed by others in subsequent editions of his work (1898, 1902-1903).
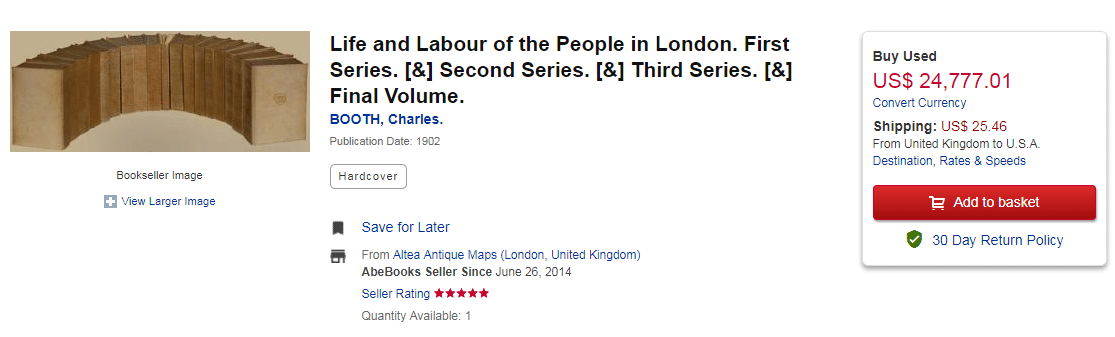
For book lovers, notice there is one complete set currently available for sale for $24,777 in London.
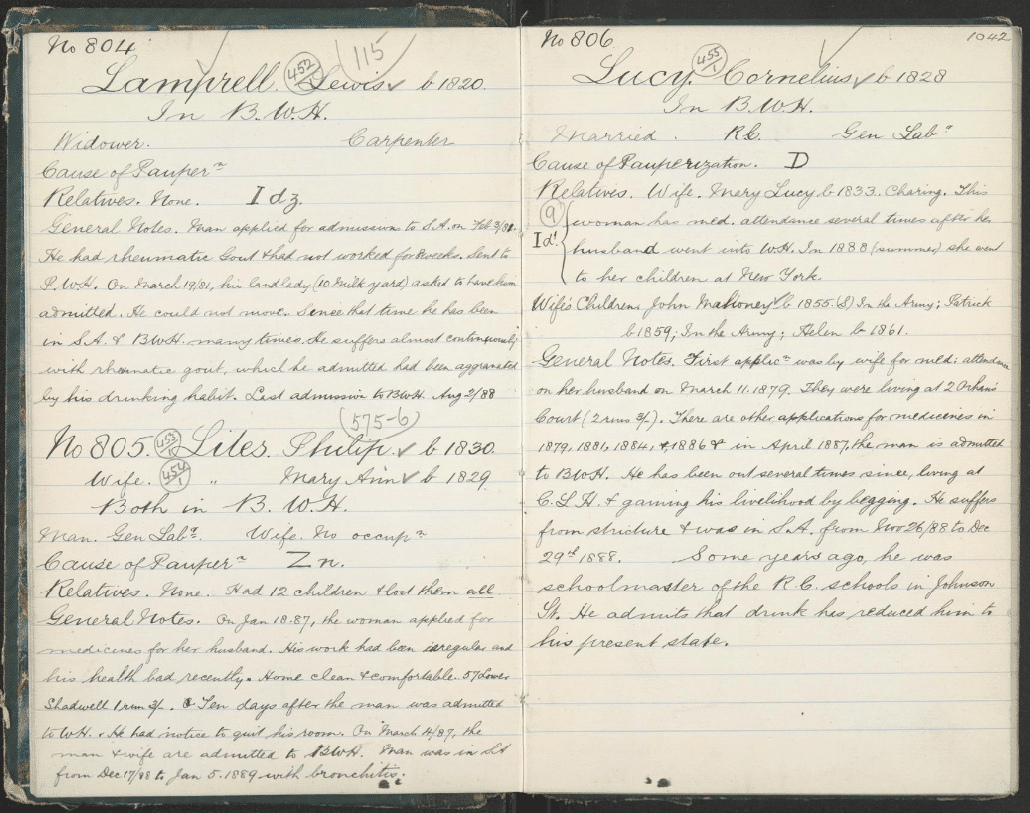
I find the notebooks especially interesting. I’ve tried to read some parts of it but it’s sometimes pretty hard to decipher what Booth and his assistants wrote. Here’s a pretty readable example below from the Stepney Union casebooks, a series of 6 notebooks on the lives of inmates of the Bromley and Stepney workhouses.
Visualising data in the 19th century
And here’s Booth’s masterpiece: the hand-coloured maps. I find it stunning how, more than a century ago, criminals already gathered together (look for instance at the Saint-George neighbourhood), forming islands of poverty and criminality. This reminded me this other data visualization project I once saw at the New-York Museum of Modern Arts (MoMa).
You’ll also notice how segregated the different classes are : one block, sometimes one street, are homogeneous. Nothing has changed so far and there is no need of algorithmic filter bubbles to leave in a different ecosystem.
My take
The Charles Booth’s project is a masterpiece of market research. It is one early example of successful combination of qualitative research (ethnography) with quantitative methods (data visualization).
We’ve forgotten today the pain of collecting data because there is so much data at hand. Yet, one should not forget that qualitative research remains a methodology of choice for those who want to access another level of knowledge and scratch the surface. Indeed, no everything has been dataified already.
Posted in big data, Marketing, Research.