Following our first article on the Big Data and Ethics meetup organized at Digityser on 15 June 2017, we’d like to cover today another very interesting presentation by Leenke De Donder.
Lenke dealt with an aspect the importance of which is, in our opinion, underestimated by data scientists and professionals in the data business : visualization. We spend a lot of time on collecting data, cleansing (data quality) and designing the most efficient algorithms. Yet, do we care so much about how all these efforts are displayed to the user ? Does the visualization enhance our efforts or does it ruin them ?
In her presentation (and her exquisitely designed slides, see below) Leenke showed that bad visualization can indeed ruin your efforts and convey bad messages to users. After all what you want to achieve is better user experience, right ?
The manipulation of graphics was an especially fun part of her presentation where she showed how figures, axis and scales can be misused to produce unfair effect on users. Who would do that you may think ? The answer is “politicians”.
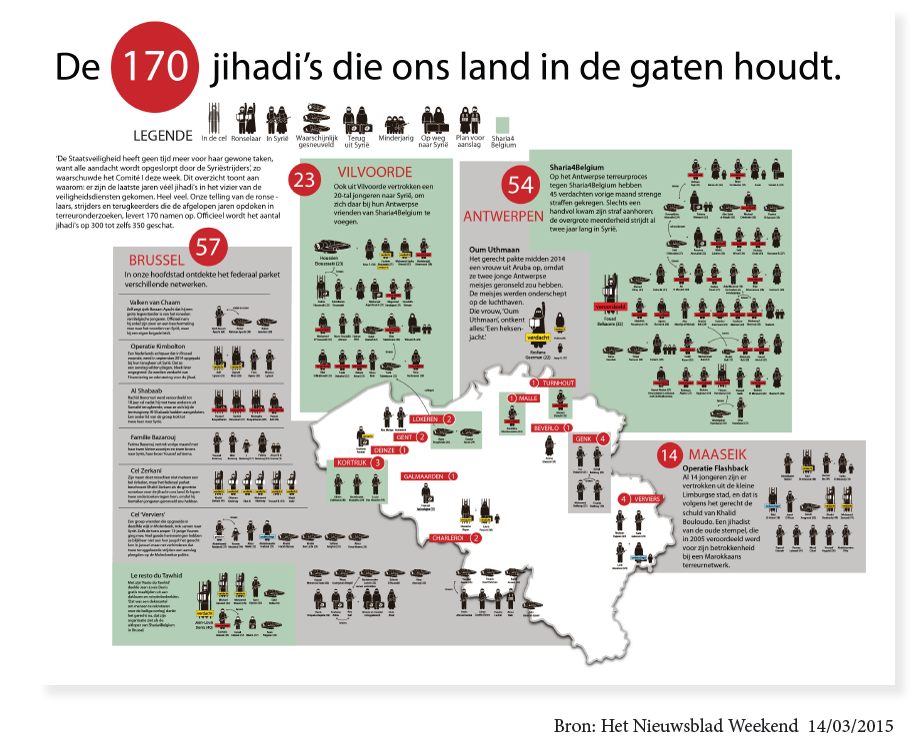
Of particular interest also was a map of jihadists in Belgium which actually made its way to a newspaper (see slide 23 below). Leenke argued that this map suffered from oversimplification and in her field work she said, people she interviewed seemed to be shocked about it. While the data may be right, we should therefore think about the effect we produce on people faced with the visualization : how will they react ? What will be their perceptions ? Does the visualization convey a fair view of the data or is it biased ?
This brings us to the third part of Leenke’s speech : transparency. We’ve talked a lot about transparency during the “Big Data and Ethics” meetup but it was mostly about the data collection and data treatment part; far less about the results obtained.
Leenke made an excellent point at allowing users to “see” the data behind the visualization. Being transparent also means giving access to the data behind your work (much like an academic researcher would do to prove the robustness of his or her results). Leenke made a proposal we’d never heard before : sharing datasets.
For more food for thought on transparency you may want to read these articles : respectful algorithms, the next revolution is transparency, transparency in targeted advertising.
Posted in big data, Marketing.